DNA Concentration Calculator
- Last formula update:
Decimal & Rounding Policy
- Calculations use full-precision values internally and do not round intermediate results.
- Rounding is applied only to displayed values to preserve calculation accuracy.
- Results are shown with practical precision based on the calculated concentration and selected unit.
- Reverse calculations use the unrounded internal value rather than the rounded display value.
- Unit conversions are completed before display rounding to prevent cumulative conversion errors.
- Very small or very large results may use compact scientific notation for readability.
Valid range
- Sample type: Select dsDNA, ssDNA, RNA, or an oligonucleotide sequence.
- Absorbance at 260 nm (A260): Use a finite, non-negative spectrophotometric absorbance value.
- Pathlength (l): Must be greater than 0; 1 cm is the standard cuvette pathlength.
- Dilution factor (DF): Must be 1 or greater; use 1 for an undiluted sample.
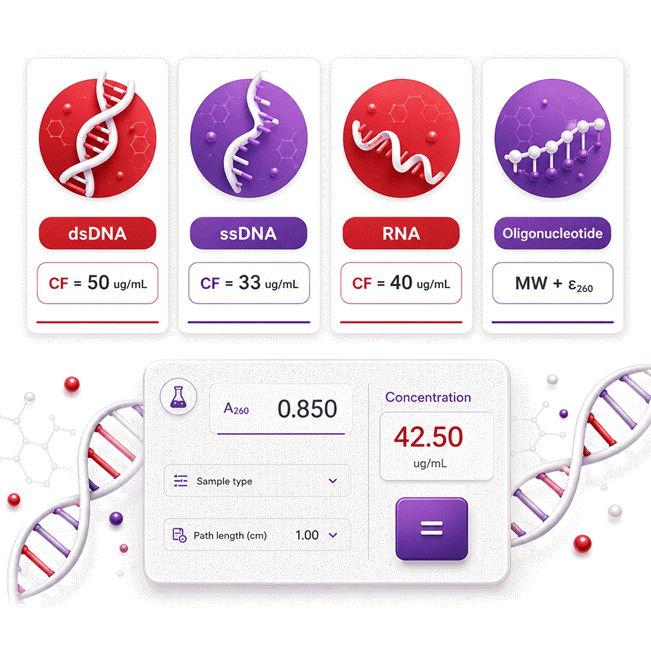
- Conversion factor (CF): Use 50 ug/mL for dsDNA, 33 ug/mL for ssDNA, and 40 ug/mL for RNA.
- Molecular weight (MW): For oligonucleotides, enter a finite value greater than 0 g/mol.
- Extinction coefficient (epsilon260): For oligonucleotides, enter a finite value greater than 0 M^-1 cm^-1.
- Concentration (C): The calculated or reverse-solved concentration must be finite and non-negative.

Olivara Dremmont
Reviewers:
Urellyn Vexmere
Ralven Pexthorne
Check our editorial policy
August 29, 2026
1.0.0
Initial calculator and formula release.
Our engineers are here to help you get it right.
How Does a DNA Concentration Calculator Help You Interpret A260 Results?
DNA Concentration Calculator turns absorbance data into a clear estimate of nucleic acid concentration using sample type, A260, optical pathlength, and dilution information. It supports double-stranded DNA, single-stranded DNA, RNA, and oligonucleotide workflows, while keeping the calculation logic transparent and easy to review.
The DNA Concentration Calculator is especially useful when one value is missing because supported variables can be solved in reverse from the remaining known data.
- Choose the correct sample type before calculating, since dsDNA, ssDNA, and RNA use different absorbance-to-concentration relationships.
- Confirm whether the instrument has already normalized A260 for optical pathlength.
- Record the dilution factor from the actual sample preparation rather than memory.
- Use molecular weight and a sequence-specific extinction coefficient for oligonucleotides when available.
- Treat unexpected values as a reason to verify sample identity, blanking, contamination, and instrument settings.
- Use reverse solving to check a missing or suspicious A260, pathlength, dilution factor, molecular weight, or extinction coefficient.
- Review the result in the context of the original laboratory measurement before downstream use.
The calculator is designed to reduce repetitive manual work, improve consistency, and make concentration calculations easier to audit, share, and understand. It is most reliable when inputs accurately represent the measured sample and conditions.
Assumptions used in this calculator
- Absorbance is assumed to represent nucleic acid measurement near 260 nm.
- Pathlength is assumed accurate and expressed through supported length units.
- A dilution factor of 1 represents an undiluted sample.
- Standard conversion factors assume conventional spectrophotometric nucleic acid behavior.
- dsDNA calculations use a conversion factor of 50 ug/mL.
- ssDNA calculations use a conversion factor of 33 ug/mL.
- RNA calculations use a conversion factor of 40 ug/mL.
- Oligonucleotide calculations assume valid molecular weight and extinction coefficient inputs.
- Extinction coefficients are assumed applicable to the measured oligonucleotide sequence.
- Samples are assumed free from significant absorbance interference by contaminants.
- Instrument calibration and blank correction are assumed to be properly performed.
- Unit conversions preserve the same physical quantity without changing calculation meaning.
- Results are estimates and require laboratory verification for critical decisions.
Results are rounded for display.
Internal calculations use full precision.
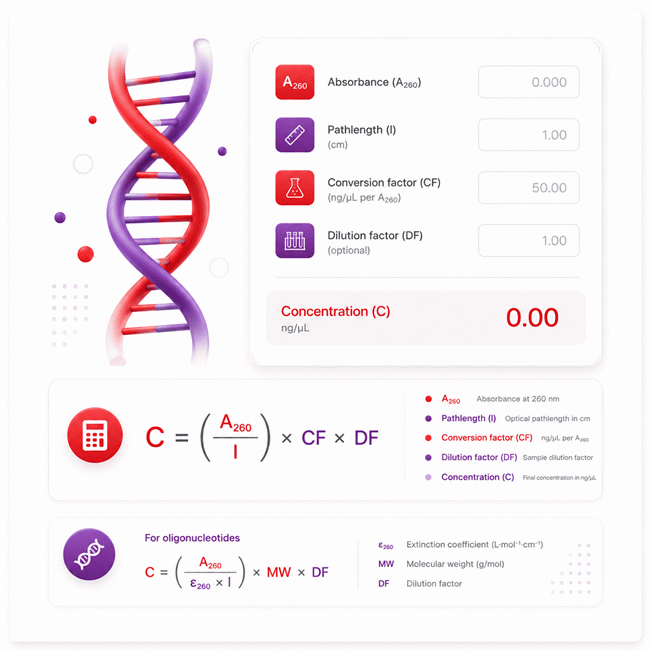
Formulas Used in DNA Concentration Calculator :
Standard DNA and RNA Concentration
Oligonucleotide Concentration
Unit Normalization
| Quantity | Selected Unit | Base-Unit Factor |
|---|---|---|
| Concentration | ug/mL | 1 |
| Concentration | ng/uL | 1 |
| Concentration | ng/mL | 0.001 |
| Concentration | mg/mL | 1000 |
| Concentration | mg/L | 1 |
| Concentration | g/L | 1000 |
| Concentration | pg/uL | 0.001 |
| Pathlength | cm | 1 |
| Pathlength | mm | 0.1 |
| Pathlength | um | 0.0001 |
| Pathlength | m | 100 |
| Molecular weight | g/mol or Da | 1 |
| Molecular weight | kDa or kg/mol | 1000 |
Variables
- C = nucleic acid concentration.
- A260 = absorbance measured at approximately 260 nm.
- l = optical pathlength expressed internally in centimeters.
- CF = sample-specific conversion factor: 50 ug/mL for dsDNA, 33 ug/mL for ssDNA, or 40 ug/mL for RNA.
- DF = dilution factor, with 1 representing an undiluted sample.
- MW = oligonucleotide molecular weight in g/mol.
- ε260 = oligonucleotide extinction coefficient in M-1 cm-1.
- xbase = value converted to the calculator's internal base unit.
- xselected = numeric value expressed in the unit selected by the user.
- kunit = conversion factor from the selected unit to the internal base unit.
Calculations use full-precision values internally. Rounding is applied only to displayed results, so reverse calculations and unit conversions use the unrounded mathematical value.
Variables & Definitions
View a complete list of all variables used in this calculator, including definitions and units
DNA Concentration Calculator Variables and Units
| Symbol | Variable | Description | Unit or Value | Role |
|---|---|---|---|---|
| C | Nucleic acid concentration | Calculated concentration of DNA, RNA, or an oligonucleotide sample. | ug/mL, ng/uL, ng/mL, mg/mL, mg/L, g/L, or pg/uL | Calculated or reverse-solved |
| A260 | Absorbance at 260 nm | Spectrophotometric absorbance measured at approximately 260 nm. | AU | Input or reverse-solved |
| l | Pathlength | Optical distance traveled by light through the nucleic acid sample. | cm, mm, um, or m | Input or reverse-solved |
| CF | Conversion factor | Sample-specific factor used to convert absorbance into nucleic acid concentration. | 50 ug/mL for dsDNA; 33 ug/mL for ssDNA; 40 ug/mL for RNA | Automatically assigned |
| DF | Dilution factor | Ratio used to correct the measured concentration for sample dilution. | Dimensionless, minimum 1 | Input or reverse-solved |
| MW | Molecular weight | Molecular mass used when calculating an oligonucleotide concentration. | g/mol, Da, kDa, or kg/mol | Oligonucleotide input or reverse-solved |
| ε260 | Extinction coefficient | Molar extinction coefficient of an oligonucleotide at approximately 260 nm. | M-1 cm-1 | Oligonucleotide input or reverse-solved |
| xbase | Base-unit value | Physical value converted to the calculator's internal base unit before calculation. | Depends on the quantity | Internal unit normalization |
| xselected | Selected-unit value | Numeric value expressed in the unit currently selected by the user. | Depends on the selected unit | Displayed or entered value |
| kunit | Unit conversion factor | Multiplier used to convert a selected unit into the calculator's internal base unit. | Dimension-dependent factor | Internal unit conversion |
Unit Conversion Table
DNA Concentration Unit Conversion Table
| Unit Group | Unit Name | Symbol | Equivalent in ug/mL | Used For |
|---|---|---|---|---|
| Popular Units | Micrograms per milliliter | ug/mL | 1 ug/mL | Base concentration calculations |
| Popular Units | Nanograms per microliter | ng/uL | 1 ug/mL | Common DNA and RNA measurements |
| Popular Units | Nanograms per milliliter | ng/mL | 0.001 ug/mL | Low-concentration nucleic acid samples |
| Scientific Units | Milligrams per milliliter | mg/mL | 1000 ug/mL | High-concentration samples |
| Scientific Units | Milligrams per liter | mg/L | 1 ug/mL | Laboratory concentration reporting |
| Scientific Units | Grams per liter | g/L | 1000 ug/mL | Concentrated solution reporting |
| Scientific Units | Picograms per microliter | pg/uL | 0.001 ug/mL | Very low-concentration samples |
DNA Pathlength Unit Conversion Table
| Unit Group | Unit Name | Symbol | Equivalent in cm | Used For |
|---|---|---|---|---|
| Popular Units | Centimeter | cm | 1 cm | Standard spectrophotometer pathlength |
| Popular Units | Millimeter | mm | 0.1 cm | Short optical pathlengths |
| Popular Units | Micrometer | um | 0.0001 cm | Microscale optical paths |
| Scientific Units | Meter | m | 100 cm | Scientific length conversion |
Oligonucleotide Molecular Weight Unit Conversion Table
| Unit Group | Unit Name | Symbol | Equivalent in g/mol | Used For |
|---|---|---|---|---|
| Popular Units | Grams per mole | g/mol | 1 g/mol | Base oligonucleotide molecular weight |
| Popular Units | Dalton | Da | Approximately 1 g/mol | Oligonucleotide molecular mass |
| Scientific Units | Kilodalton | kDa | 1000 g/mol | Larger molecular mass values |
| Scientific Units | Kilograms per mole | kg/mol | 1000 g/mol | SI molar mass conversion |
Example Calculation
Given Values
- Sample type: Double-stranded DNA
- A260: 0.72 AU
- Pathlength: 0.5 cm
- Conversion factor: 50 ug/mL
- Dilution factor: 8
Formula
Calculation
Results
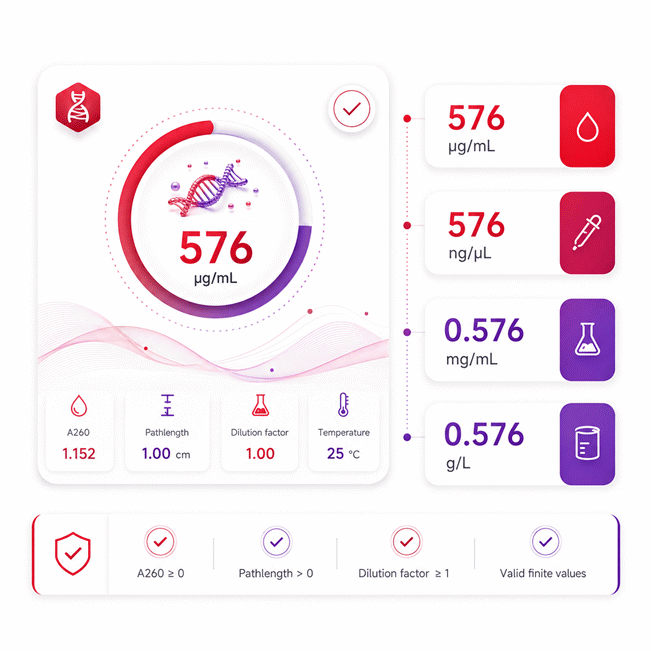
576 ug/mL
- 576 ng/uL
- 576 mg/L
- 0.576 mg/mL
- 0.576 g/L
A double-stranded DNA sample with an absorbance of 0.72 is measured using a 0.5 cm optical path and an eightfold dilution. The calculation first corrects absorbance for pathlength, then applies the dsDNA conversion factor and dilution factor. The resulting DNA concentration is 576 ug/mL. Equivalent units represent the same physical concentration and do not change the calculated result.
Standard DNA and RNA calculations use concentration-compatible conversion factors. Oligonucleotide calculations require unit-consistent molecular weight and extinction coefficient values, and concentration units must be converted consistently when mass-unit scaling is required.
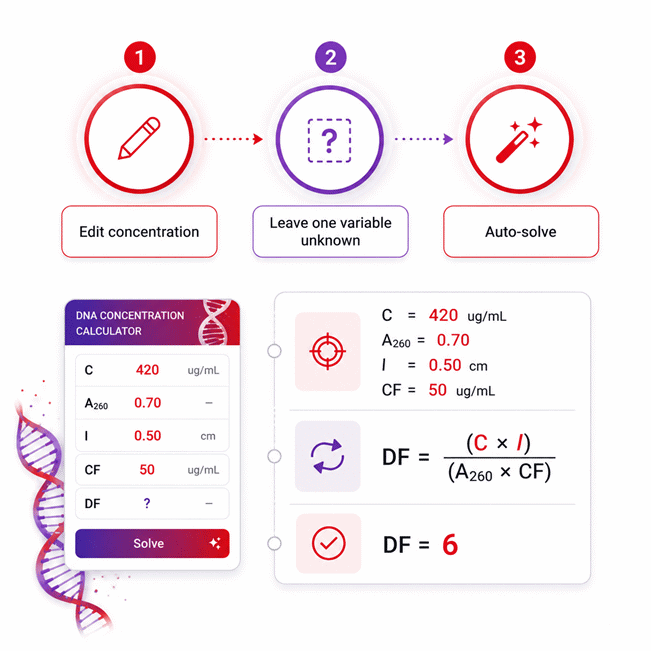
Known Values
- Sample type: Double-stranded DNA
- Concentration: 420 ug/mL
- A260: 0.70 AU
- Pathlength: 0.50 cm
- Conversion factor: 50 ug/mL
- Dilution factor: Unknown
Reverse Formula
Solution
Result
Dilution Factor = 6x
The measured sample represents a sixfold dilution.
In this reverse calculation, the DNA concentration is already known and the dilution factor is the missing variable. The concentration equation is rearranged without changing the underlying calculation method. Substituting the known absorbance, pathlength, conversion factor, and concentration gives a dilution factor of 6. The calculator can solve the same relationship automatically whenever exactly one supported equation variable is unknown.
Standard DNA and RNA reverse calculations use the sample-specific conversion factor assigned to the selected nucleic acid type. Oligonucleotide calculations use molecular weight and the extinction coefficient, with the factor 1000 converting the mass result to ug/mL when molecular weight is entered in g/mol. All reverse calculations use full internal precision and should have exactly one unknown equation variable.
Results are rounded for display.
Internal calculations use full precision.
Calculations Disclaimer
How Does a DNA Concentration Calculator Turn A260 Into Useful Laboratory Data?
A raw absorbance value often creates more questions than answers. A260 tells you how strongly a sample absorbs ultraviolet light. It does not describe concentration by itself. Sample type, optical path, and dilution also affect interpretation.
A DNA Concentration Calculator connects these measurements into one usable result. It helps convert laboratory readings into practical concentration data. The process works for common nucleic acid sample types. These include double-stranded DNA, single-stranded DNA, RNA, and oligonucleotides.
The main advantage is speed without hiding the scientific logic. You enter the known laboratory values. The calculator then interprets them using the selected sample type. This prevents many repetitive manual steps.
The tool becomes especially useful during busy laboratory workflows. Small entry mistakes can propagate through several later steps. A missed dilution correction may change the reported concentration significantly. A wrong sample type can also shift the final value.
The calculator reduces that risk by keeping related parameters together. It also gives users a clear view of the measurement context.
For routine work, this creates a simple workflow. Measure the sample correctly. Choose the correct nucleic acid type. Enter the known values. Then review the calculated result before using it downstream.
The most useful feature appears when one value is missing. The calculator can also work backward. That means a known concentration can help recover another unknown quantity.
This two-way workflow is valuable for checking laboratory records. It also helps identify transcription mistakes. Instead of repeating calculations manually, users can test the relationship immediately.
AxiCalculator is designed for this practical laboratory decision process. The goal is not more complexity. The goal is faster interpretation with fewer avoidable mistakes.
Why Does A260 Reflect the Amount of Nucleic Acid?
A spectrophotometer may show a clear A260 reading but little context. Nucleic acids absorb ultraviolet light strongly near 260 nm. Their nitrogen-containing bases contribute much of this absorption.
As nucleic acid concentration rises, absorbance usually rises too. This relationship makes A260 useful for routine quantification.
However, the reading is not an isolated concentration measurement. It describes how much light was absorbed under specific conditions.
The optical path affects that reading. Sample composition also matters. Dilution changes the measured amount further.
This is why a single A260 value needs context. Two samples can show identical absorbance values. Their actual concentrations can still differ.
The selected nucleic acid type is particularly important. Different nucleic acids do not use identical concentration relationships.
A260 therefore acts as the measurement anchor. It becomes useful concentration data only after proper interpretation.
Why Can the Same A260 Reading Produce Different Results?
Two technicians may record the same A260 value and obtain different concentrations. That does not always mean one calculation is wrong.
The difference may come from sample type. Double-stranded DNA behaves differently from single-stranded DNA. RNA also requires its own interpretation.
Optical path can create another difference. A conventional cuvette often uses a longer light path. Microvolume systems may use much shorter paths.
Dilution can change the result again. A diluted measurement represents only part of the original concentration.
The result therefore depends on the full measurement setup. A260 alone cannot capture that context.
This point matters during troubleshooting. A strange result should not trigger immediate repetition. First review sample type, pathlength, and dilution information.
That short check often reveals the real problem faster.
Why Do dsDNA, ssDNA, and RNA Need Different Treatment?
A common laboratory mistake starts with choosing the wrong sample category. DNA and RNA all absorb near 260 nm. Their concentration behavior is not identical.
The structural state of the nucleic acid matters. Base stacking changes optical behavior. Double-stranded and single-stranded molecules therefore respond differently.
RNA has its own characteristic response. That difference changes how absorbance becomes concentration.
The practical lesson is simple. Do not treat every A260 reading as generic DNA.
Choose the sample type before trusting the result. This step takes seconds. It can prevent a systematic concentration error across many samples.
The distinction matters even more when measurements guide later laboratory steps. Incorrect concentration estimates can affect reaction setup. They can also affect normalization between samples.
A clear sample selection step therefore improves both speed and consistency.
Why Does Double-Stranded DNA Need Its Own Setting?
A DNA sample may look ordinary while still requiring careful classification. Double-stranded DNA is common in molecular biology workflows. It has a predictable optical response under standard conditions.
That predictable behavior makes A260 useful for routine estimation. However, the result still depends on correct measurement conditions.
Pathlength must represent the actual optical setup. Dilution must reflect sample preparation. The sample should also match the selected category.
If a double-stranded sample is entered as another nucleic acid type, the calculated result shifts. That error can appear consistent across every sample.
Consistency does not make the result correct. Correct sample identification remains essential.
Why Is Single-Stranded DNA Different?
A single-stranded sample can absorb light differently from double-stranded DNA. Base exposure and molecular structure change optical behavior.
This difference becomes important when working with primers, probes, or related materials. Using a double-stranded setting can distort the result.
Single-stranded DNA also covers a wide range of molecule sizes. Short sequences deserve extra care. Their sequence composition may become more important.
For routine single-stranded material, the standard sample setting provides a practical estimate. For short oligonucleotides, a more sequence-specific approach is preferable.
That distinction keeps simple workflows simple. It also protects advanced work from oversimplification.
Why Does RNA Require Its Own Selection?
RNA samples often enter the same spectrophotometer used for DNA. This can make the workflow appear identical.
The measurement step may look similar. The interpretation is not identical.
RNA has its own absorbance-to-concentration behavior. Selecting RNA ensures the tool uses the correct sample context.
This matters when comparing multiple RNA preparations. A consistent method makes those comparisons more reliable.
It also prevents accidental reuse of a DNA setting. That mistake is easy during repetitive bench work.
A simple sample selector removes much of that risk.
Why Do Pathlength and Dilution Change the Final Concentration?
A concentration result can look suspicious even when A260 is correct. Two hidden causes often explain the difference. Pathlength and dilution are common sources.
Pathlength describes the distance light travels through the sample. A longer path produces more absorbance for the same concentration.
Modern instruments can use very short optical paths. Some systems also normalize readings automatically.
This creates an important workflow question. Is the displayed absorbance already normalized?
Entering another correction unnecessarily can distort the final result. Users should therefore understand how their instrument reports absorbance.
Dilution creates a different problem. The instrument measures the diluted sample in front of it.
The original tube may contain a much higher concentration. The dilution information reconnects the measured sample with that original material.
Both variables can cause large errors when entered incorrectly. They deserve the same attention as the A260 reading.
What Happens When the Optical Path Is Shorter?
A microvolume instrument can use a tiny sample and a short optical path. This helps measure concentrated material without excessive absorbance.
The reading may then be normalized by the instrument. That behavior depends on the measurement system.
Users should avoid assuming that every displayed A260 value is raw. Check how the instrument reports its result.
If the absorbance is already normalized, another manual correction can create an error. If it is not normalized, the actual path must be considered.
This is one reason laboratory metadata matters. A number without measurement context can be misleading.
Why Is Dilution Information Easy to Get Wrong?
A technician may prepare a dilution correctly but record it poorly. The absorbance reading can still look perfectly reasonable.
The final concentration then becomes misleading. The error comes from the sample history, not the instrument.
Dilution information should therefore be recorded during preparation. Do not rely on memory later.
The undiluted state should also be treated consistently. This keeps calculations clear across different samples.
Reverse solving can help expose suspicious dilution records. A known concentration can reveal the dilution relationship required mathematically.
That creates a useful quality-control check before repeating laboratory work.
Why Are Oligonucleotides More Demanding?
A short oligonucleotide can look like simple single-stranded DNA. Its optical behavior can be more sequence-dependent.
Short sequences contain different proportions of individual bases. Those bases do not absorb ultraviolet light equally.
Sequence order can also influence the measured behavior. This makes a generic single-stranded approximation less ideal for precise work.
Oligonucleotide calculations therefore benefit from sequence-specific information. Molecular weight becomes important. The extinction coefficient becomes important too.
Together, these values describe the oligonucleotide more specifically.
This approach is especially helpful when accurate mass concentration matters. It avoids treating every short sequence as optically identical.
The workflow remains straightforward. Use standard settings for standard nucleic acid samples. Use the oligonucleotide mode when sequence-specific values are available.
This keeps the calculator easy for beginners. It also preserves useful depth for experienced laboratory users.
Why Does Molecular Weight Matter for Oligonucleotides?
An oligonucleotide result may need conversion between molar and mass information. Molecular weight connects those two descriptions.
Two sequences can have similar absorbance behavior. Their molecular weights may still differ.
That difference affects the final mass concentration. Molecular weight therefore becomes part of the oligonucleotide workflow.
The value should match the actual sequence material being measured. Modified oligonucleotides deserve additional attention.
Chemical modifications can change molecular mass. Some modifications may also affect optical behavior.
Using sequence-specific information improves the quality of the estimate.
Why Does the Extinction Coefficient Matter?
Two oligonucleotides can show different absorbance behavior at equal molar concentration. Their base compositions may differ.
The extinction coefficient captures this optical difference. It connects absorbance with molar concentration.
A sequence-specific coefficient is therefore more informative than a generic assumption. This becomes increasingly important for shorter sequences.
It also helps users avoid a common shortcut. Not every oligonucleotide should be treated as generic single-stranded DNA.
The more precise the application, the more valuable this distinction becomes.
How Can Reverse Solving Help During Real Laboratory Work?
A laboratory record may contain the final concentration but miss one input. Repeating the entire workflow may waste time.
Reverse solving provides another option. The calculator can use known values to recover one missing quantity.
This is not a separate scientific method. It uses the same relationship in the opposite direction.
The feature is useful during record checks. It can also help review older experiment sheets.
A known result may help reconstruct a missing absorbance value. A known concentration can also reveal the required dilution relationship.
Pathlength can be checked in the same way when other data are known.
For oligonucleotides, reverse solving can support deeper checks. Molecular weight or extinction information can be tested against recorded values.
The key rule is simple. Only one unknown should remain.
If several values are missing, the equation cannot identify one unique answer. More independent information is required.
This limitation protects the user from false certainty.
How Can Reverse Solving Reveal a Recording Error?
A technician may notice that one recorded value looks unusual. The result may still appear plausible.
Reverse solving creates a fast consistency test. Enter the values that are trusted. Leave the suspicious quantity unknown.
The calculator then determines which value fits the remaining information.
A large difference can reveal a transcription error. It may also expose an incorrect dilution note.
This does not replace laboratory verification. It does provide a fast reasonableness check.
That can save time before repeating an experiment.
Why Must Only One Quantity Be Unknown?
A single mathematical relationship has limited information. It cannot usually determine several missing quantities independently.
This matters because calculator interfaces can create false confidence. A number on screen may appear authoritative.
Good reverse solving should avoid guessing. It should solve only when the information is sufficient.
Leaving one unknown creates a clear mathematical target. Leaving several unknowns creates many possible solutions.
A reliable calculator should preserve that distinction.
What Common Errors Can Distort DNA Concentration Results?
A concentration value may look precise while the measurement process contains several errors. Precision on screen does not guarantee experimental quality.
Contamination is one major problem. Proteins and chemical residues can affect ultraviolet absorbance.
Phenol and other extraction chemicals can also distort the spectrum. This may make nucleic acid concentration appear higher.
Blanking creates another risk. The blank should represent the same background solution as the sample.
A mismatched blank can shift the baseline. That error then affects every measured sample.
Sample handling also matters. Residue on measurement surfaces can influence microvolume readings.
Air bubbles can disrupt optical measurements. Poor mixing can create concentration differences within the same tube.
Wrong sample selection creates a more subtle problem. The instrument may behave correctly while the calculation context is wrong.
Pathlength misunderstandings can cause another systematic error. This is especially important with microvolume systems.
Dilution records should also be checked carefully. A small notation error can create a large final difference.
The best response is not panic. Use a short troubleshooting sequence.
Check sample identity first. Check the instrument method next. Review the blank. Confirm dilution history. Then inspect the optical-path information.
This sequence often identifies the cause quickly.
Why Can Contamination Make Concentration Look Higher?
A contaminated sample can absorb ultraviolet light for reasons unrelated to DNA. The instrument measures total absorbance reaching the detector.
It cannot automatically assign every absorbed photon to nucleic acid.
This means some contaminants can inflate the apparent concentration. Others can change the spectrum in more complex ways.
A suspicious result should therefore be reviewed alongside sample purity information. Laboratory context remains essential.
A concentration calculator can interpret measurement data. It cannot remove contaminants from the sample.
Why Can a Correct Calculation Still Produce a Bad Laboratory Decision?
Every entered value can be mathematically valid and experimentally wrong. This distinction is easy to miss.
The calculator assumes the measurements represent the real sample correctly. It cannot inspect the tube itself.
An incorrect blank can produce valid-looking numbers. A wrong sample label can do the same.
This is why result review matters before downstream work. Calculation quality and measurement quality are connected.
The safest workflow combines both.
How Should You Check a DNA Concentration Result Before Using It?
A calculated concentration may be ready instantly. A ten-second review can prevent much longer troubleshooting later.
Start with sample type. Confirm that DNA, RNA, or oligonucleotide mode matches the material.
Then review the absorbance entry. A misplaced decimal can create a dramatic difference.
Check the optical path context next. Confirm whether the instrument already normalized absorbance.
Review dilution history carefully. Compare the entered value with the actual preparation steps.
For oligonucleotides, verify sequence-specific information. Molecular weight and extinction data should belong to the same material.
Next, judge whether the final value makes sense for the workflow. Extreme values deserve another look.
A surprising result is not automatically wrong. It should simply trigger verification.
This habit helps distinguish calculation errors from real experimental differences.
AxiCalculator also makes record review easier. Results can be shared or exported with their associated inputs.
That improves communication between laboratory staff. It also reduces the risk of sending a concentration value without its calculation context.
What Should You Check When Two Measurements Disagree?
Two measurements from the same sample can disagree unexpectedly. Repeating the calculation alone may not solve the problem.
Check whether both measurements used the same instrument settings. Confirm pathlength behavior.
Then compare blanking conditions. A different blank can change the baseline.
Inspect the measurement surface or cuvette. Residue can affect optical readings.
Mix the sample carefully before another measurement. Concentration may not be perfectly uniform after handling.
Finally, compare dilution history. One sample may have been corrected differently.
This structured check is faster than changing several variables randomly.
How Can AxiCalculator Support a Clearer Laboratory Workflow?
A laboratory calculation becomes less useful when its context gets separated. A standalone concentration value can be difficult to audit later.
AxiCalculator keeps the main measurement inputs together. This makes the result easier to understand and review.
The calculator also supports reverse solving. That gives users another way to test incomplete records.
Compatible unit handling reduces unnecessary manual conversion work. Users can work with familiar laboratory units.
Export tools help preserve the calculation state. Shared results can also carry useful context between team members.
These features support a simple workflow.
Measure carefully. Enter the known values. Review the result. Check anything unexpected. Then save or share the calculation when needed.
The interface is designed to keep that process quick. It does not require a separate calculation button.
Results update as the relevant information changes. This makes troubleshooting more interactive.
The real value is not a larger number of features. It is a clearer path from measurement to decision.
For routine DNA, RNA, and oligonucleotide work, that clarity saves time. It also makes calculation logic easier to review.
When a result matters, use the calculator as part of the laboratory workflow. Keep the original measurement data available. Confirm the sample context. Then use the calculated concentration with confidence grounded in the underlying experiment.
Frequently Asked Questions
What should I do if my DNA sample gives an absorbance reading outside the reliable measurement range?
Why should the blank solution match the buffer used for my nucleic acid sample?
Can reverse solving help recover missing information from an old laboratory record?
Why might two instruments report different concentrations for the same nucleic acid sample?
How should I handle a short or chemically modified oligonucleotide during concentration calculation?
Can a reverse-solved optical pathlength be used to verify an instrument record?
What should I investigate when the calculated concentration looks correct but downstream experiments still fail?
Engineering Resources
Our engineers are here to help you get it right.