Meat Footprint Calculator
- Last formula update:

Decimal & Rounding Policy
- All meat footprint calculations use full numerical precision through every intermediate calculation.
- Rounding is applied only to displayed results, never to stored values, conversions, or reverse calculations.
- Standard results may display up to 6 decimal places while unnecessary trailing zeros are removed.
- Very large or very small values may use scientific notation to preserve readability and precision.
- Unit changes convert the original physical value before display rounding, preventing cumulative conversion errors.
- Reverse solving uses unrounded environmental factors and unrounded known contributions before displaying the solved input.
Valid range
- Meat consumption values must be finite, non-negative numbers within the calculator’s supported numerical range.
- A value of 0 is valid and represents no consumption of that meat type.
- Blank meat fields are allowed during normal calculations and contribute nothing to the calculated footprint.
- Supported meat input values range from 0 through 1,000,000,000,000 in the currently selected input unit.
- Reverse-result values must be finite and non-negative and must produce a physically non-negative unknown consumption value.
- Reverse solving requires exactly one unknown meat input for a unique solution.
- A reverse target cannot be smaller than the footprint already produced by all known meat inputs.
- Only dimensionally compatible units are valid for each input and environmental result.
- Unsupported, malformed, infinite, negative, or unsafe URL values are rejected before calculation.

Tivessa Zorquell
Reviewers:
Veralisse Noxmere
Sarven Kestthorne
Check our editorial policy
September 13, 2026
1.0.0
Initial calculator and formula release.
Our engineers are here to help you get it right.
What Does a Meat Footprint Calculator Reveal About Your Diet?
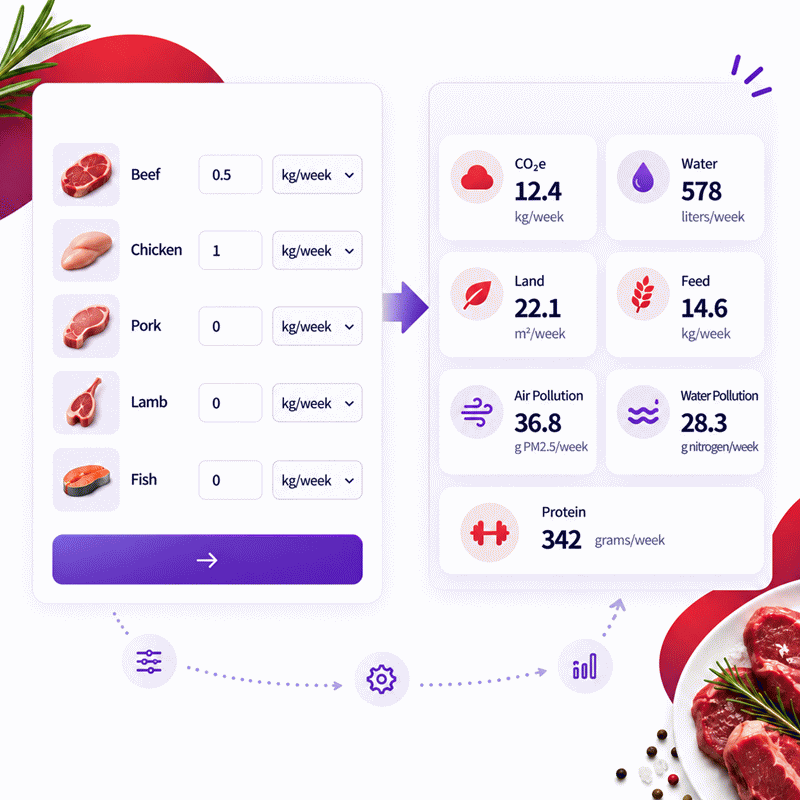
Meat Footprint Calculator results turn your meat consumption into estimated environmental impacts you can compare and understand. Instead of showing carbon alone, the calculation can reveal how beef, chicken, pork, lamb, and fish contribute differently to greenhouse gas emissions, water demand, land use, animal feed requirements, acidification, and eutrophication.
- Enter each meat type separately for a clearer environmental breakdown.
- Compare results on the same weight, serving, and time basis.
- Use CO2e to compare the combined climate impact of greenhouse gases.
- Check water and land alongside carbon for a broader environmental picture.
- Identify which meat category contributes most before testing reductions.
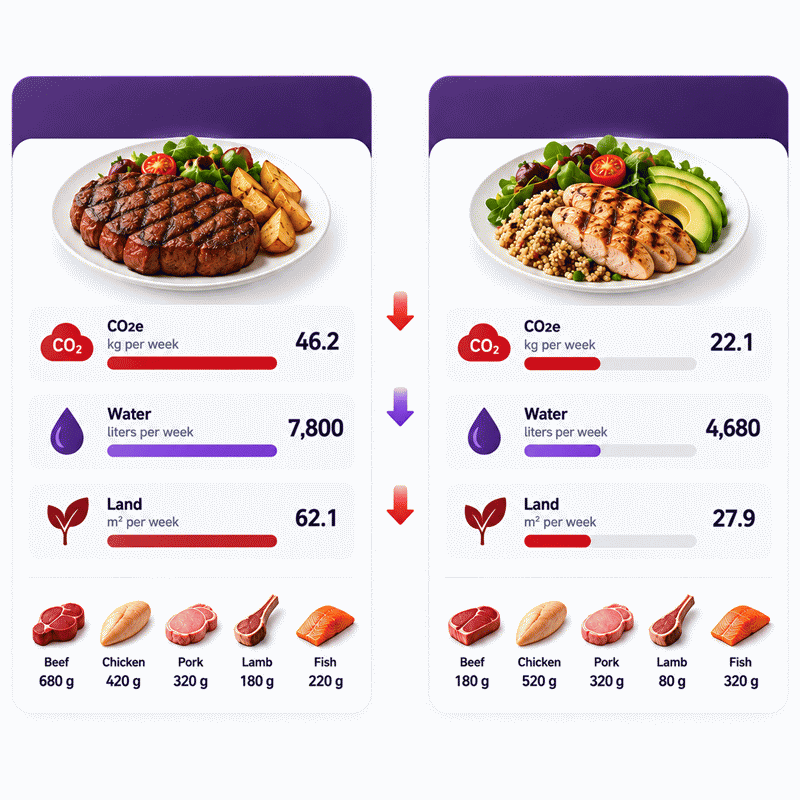
- Use scenario comparisons to see how a realistic diet change affects results.
- Treat results as estimates based on representative environmental factors.
- Expect real production impacts to vary by farm, geography, feed, and supply chain.
The Meat Footprint Calculator is most useful as a comparison and scenario-testing tool. It helps households, students, researchers, and sustainability teams identify environmental hotspots without treating an average estimate as a product-specific environmental audit.
Assumptions used in this calculator
- Environmental factors represent average production conditions rather than individual farms.
- Each entered meat quantity represents edible meat weight consumed.
- Production impacts scale linearly with the quantity of meat consumed.
- Environmental coefficients remain constant throughout the selected calculation period.
- Geographic production differences are not individually modeled.
- Farm-specific energy mixes are not individually modeled.
- Transportation differences are included only within underlying average footprint factors.
- Food waste beyond represented life-cycle averages is not separately entered.
- Water values represent average water footprints per kilogram of meat.
- Land use represents annualized land occupation per kilogram of meat.
- Reverse solving assumes exactly one meat consumption value is unknown.
- Unit conversions preserve the physical quantity before result rounding.
- Displayed estimates should not replace certified product life-cycle assessments.
Results are rounded for display.
Internal calculations use full precision.
Formulas Used in Meat Footprint Calculator :
1. Convert the entered consumption to the annual base quantity
2. Scale annual consumption to the selected result period
3. Calculate each environmental footprint
4. Calculate carbon-equivalent comparison outputs
5. Solve an unknown meat quantity from an editable result
6. Convert the solved period quantity back to the selected input unit
7. Period factors
8. Environmental factor matrix used by the calculator
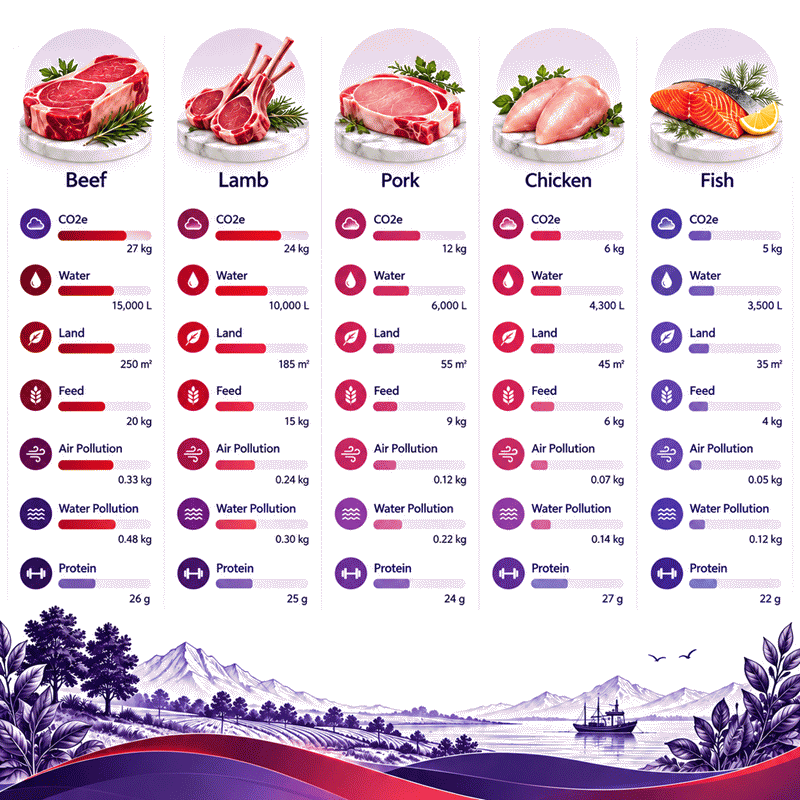
- Chicken/poultry: CO2e 9.8 kg/kg, water 4,300 L/kg, land 12.2 m²-year/kg, feed 3.3 kg/kg, acidification 102.4 g SO2e/kg, eutrophication 48.7 g PO4e/kg, protein 0.172 kg/kg.
- Beef: CO2e 85.2 kg/kg, water 15,400 L/kg, land 326.2 m²-year/kg, feed 25 kg/kg, acidification 318.8 g SO2e/kg, eutrophication 301.4 g PO4e/kg, protein 0.199 kg/kg.
- Pork: CO2e 11.5 kg/kg, water 6,000 L/kg, land 17.4 m²-year/kg, feed 6.4 kg/kg, acidification 142.7 g SO2e/kg, eutrophication 76.4 g PO4e/kg, protein 0.163 kg/kg.
- Lamb: CO2e 32.7 kg/kg, water 10,400 L/kg, land 369.8 m²-year/kg, feed 15 kg/kg, acidification 139 g SO2e/kg, eutrophication 97.1 g PO4e/kg, protein 0.200 kg/kg.
- Fish: CO2e 12.5 kg/kg, water 2,000 L/kg, land 8.4 m²-year/kg, feed 1.4 kg/kg, acidification 176 g SO2e/kg, eutrophication 235 g PO4e/kg, protein 0.227 kg/kg.
9. Carbon comparison constants
Variables & Definitions
View a complete list of all variables used in this calculator, including definitions and units
Meat Footprint Calculator Variables and Calculation Parameters
| Variable | Name | Meaning | Base Unit | Role |
|---|---|---|---|---|
| xi | Entered consumption | User-entered consumption for meat type i | Selected unit | Input |
| Ui | Input conversion function | Converts the selected consumption unit to kilograms per year | Conversion function | Unit conversion |
| qi | Annual meat quantity | Normalized annual consumption of meat type i | kg/year | Intermediate |
| pt | Period factor | Scales annual consumption to day, week, month, or year | Dimensionless | Period scaling |
| Mi | Period meat quantity | Quantity of meat type i consumed during the selected result period | kg | Intermediate |
| fi,k | Environmental factor | Average footprint factor for meat type i and impact category k | Category-specific per kg | Coefficient |
| Yk | Environmental result | Total result for environmental category k | Category-specific | Output |
| YCO2e | Carbon-equivalent result | Total greenhouse-gas footprint expressed as carbon dioxide equivalent | kg CO2e | Output |
| cj | Comparison constant | Carbon amount represented by comparison output j | kg CO2e per comparison unit | Coefficient |
| Ej | Comparison equivalent | Tree, gasoline, or passenger-vehicle comparison result | Comparison-specific | Output |
| Yk* | Target result | User-edited environmental result used for reverse solving | Category-specific | Reverse input |
| u | Unknown meat index | The single meat type being solved during reverse calculation | Index | Reverse calculation |
| K | Known meat set | All meat types with specified consumption values during reverse solving | Set | Reverse calculation |
| Mu | Solved period quantity | Calculated quantity of the unknown meat during the selected period | kg | Reverse result |
| xu | Solved displayed input | Reverse-calculated meat quantity converted to the selected input unit | Selected unit | Reverse result |
Unit Conversion Table
Meat Footprint Calculator Unit Conversion Table
| Unit Group | Unit Name | Symbol | Equivalent in Calculator Base Unit | Used For |
|---|---|---|---|---|
| Weight-Based Meat Consumption Units | ||||
| Popular Units | Kilograms per week | kg/week | 1 kg/week = 52.1775 kg/year | Meat consumption input |
| Popular Units | Grams per day | g/day | 1 g/day = 0.3652425 kg/year | Meat consumption input |
| Popular Units | Pounds per week | lb/week | 1 lb/week = 23.6682 kg/year | Meat consumption input |
| Popular Units | Ounces per day | oz/day | 1 oz/day = 10.3527 kg/year | Meat consumption input |
| Popular Units | Kilograms per month | kg/month | 1 kg/month = 12 kg/year | Meat consumption input |
| Scientific Units | Kilograms per day | kg/day | 1 kg/day = 365.2425 kg/year | Meat consumption input |
| Scientific Units | Kilograms per year | kg/year | 1 kg/year = 1 kg/year | Meat consumption input |
| Scientific Units | Grams per week | g/week | 1 g/week = 0.0521775 kg/year | Meat consumption input |
| Serving-Based Meat Consumption Units | ||||
| Popular Units | Servings per week | servings/week | 1 serving/week = 4.43509 kg/year | Meat consumption input |
| Popular Units | Servings per day | servings/day | 1 serving/day = 31.0456 kg/year | Meat consumption input |
| Popular Units | Servings per month | servings/month | 1 serving/month = 1.02 kg/year | Meat consumption input |
| Scientific Units | Servings per year | servings/year | 1 serving/year = 0.085 kg/year | Meat consumption input |
| Mass Result Units | ||||
| Popular Units | Kilogram | kg | 1 kg = 1 kg | CO2 equivalent, animal feed, protein |
| Popular Units | Pound | lb | 1 lb = 0.45359237 kg | CO2 equivalent, animal feed, protein |
| Popular Units | Gram | g | 1 g = 0.001 kg | CO2 equivalent, animal feed, protein |
| Scientific Units | Metric tonne | t | 1 t = 1,000 kg | Large mass results |
| Scientific Units | Milligram | mg | 1 mg = 0.000001 kg | Small mass results |
| Water Volume Units | ||||
| Popular Units | Liter | L | 1 L = 1 L | Water footprint |
| Popular Units | US gallon | US gal | 1 US gal = 3.785411784 L | Water footprint |
| Scientific Units | Cubic meter | m³ | 1 m³ = 1,000 L | Large water footprint results |
| Scientific Units | Milliliter | mL | 1 mL = 0.001 L | Small water quantities |
| Land Area Units | ||||
| Popular Units | Square meter | m² | 1 m² = 1 m² | Land use |
| Popular Units | Square foot | ft² | 1 ft² = 0.09290304 m² | Land use |
| Popular Units | Acre | acre | 1 acre = 4,046.8564224 m² | Large land-use results |
| Scientific Units | Hectare | ha | 1 ha = 10,000 m² | Large land-use results |
| Pollution Mass Units | ||||
| Popular Units | Gram | g | 1 g = 1 g | Acidification and eutrophication results |
| Popular Units | Kilogram | kg | 1 kg = 1,000 g | Large pollution results |
| Scientific Units | Milligram | mg | 1 mg = 0.001 g | Small pollution results |
| Gasoline Equivalent Units | ||||
| Popular Units | US gallon | US gal | 1 US gal = 1 US gal | Gasoline carbon equivalent |
| Popular Units | Liter | L | 1 L = 0.26417205236 US gal | Gasoline carbon equivalent |
| Scientific Units | Cubic meter | m³ | 1 m³ = 264.17205236 US gal | Large gasoline-equivalent results |
| Vehicle Distance Units | ||||
| Popular Units | Mile | mi | 1 mi = 1 mi | Passenger vehicle distance equivalent |
| Popular Units | Kilometer | km | 1 km = 0.621371192237 mi | Passenger vehicle distance equivalent |
| Scientific Units | Meter | m | 1 m = 0.000621371192237 mi | Small distance-equivalent results |
| Count Units | ||||
| Popular Units | Count | count | 1 count = 1 count | Tree seedling equivalent |
Example Calculation
- CO2 equivalent: 110.08 kg CO2e/week
- Water footprint: 21,920 L/week
- Land use: 401.2 m²-year
- Animal feed required: 32.64 kg/week
- Air pollution: 464.48 g SO2e/week
- Water pollution: 400.64 g PO4e/week
- Protein from meat: 0.3764 kg/week
- Tree seedling equivalent: 1.834667
- Gasoline equivalent: 12.386632 US gal
- Passenger vehicle distance equivalent: 272.475248 mi
The calculation multiplies each weekly meat quantity by its matching environmental factor and then adds the contributions. No intermediate value is rounded before totals are calculated. Unit conversions, when selected, are performed after the physical result has been determined. Display rounding therefore does not alter the underlying footprint value.
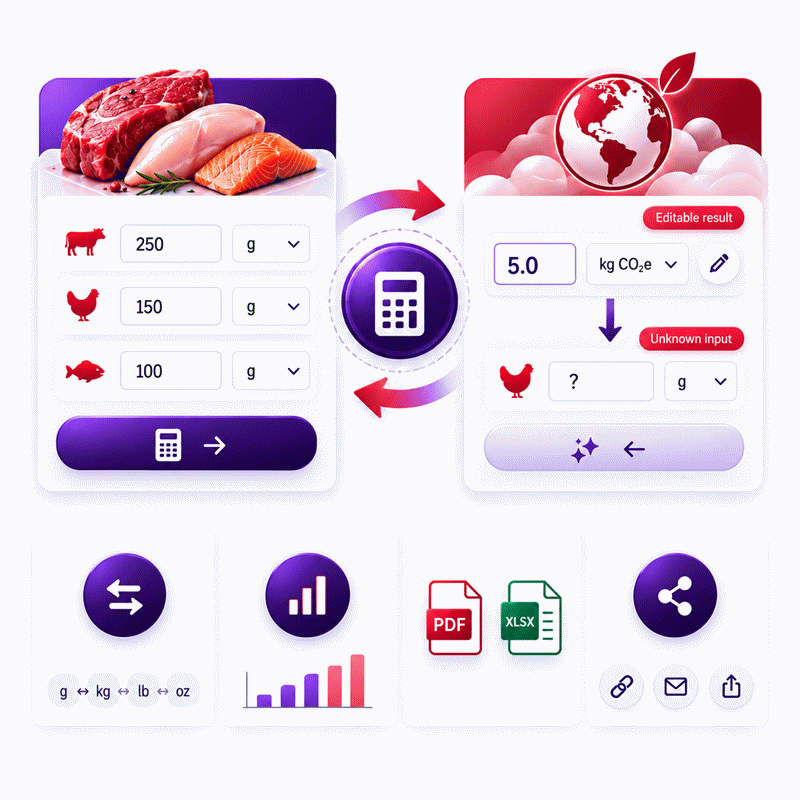
Reverse solving isolates the single unknown meat contribution from the editable target result. The known chicken footprint is calculated first and subtracted from the target CO2 equivalent. The remaining footprint is divided by the beef CO2 factor without intermediate rounding. The solved physical quantity is then converted to whichever compatible input unit the user selected.
Results are rounded for display.
Internal calculations use full precision.
Calculations Disclaimer
What Does a Meat Footprint Calculator Tell You About Your Diet?
You know how much meat you eat, but the environmental cost is harder to see. A Meat Footprint Calculator turns that hidden impact into useful numbers. The Meat Footprint Calculator connects your consumption with carbon emissions, water demand, land use, feed demand, and pollution indicators.
This matters because two meals with the same weight can have very different impacts. A kilogram of beef cannot be treated like a kilogram of chicken. Their production systems differ. Their feed needs differ. Their emissions also differ.
AxiCalculator separates five common meat groups: chicken or poultry, beef, pork, lamb, and fish. You can enter the foods you consume and leave unused categories at zero. The tool then combines each amount with its matching environmental factor.
The result is more useful than a carbon number alone. Carbon tells one part of the story. Water tells another. Land demand adds another layer. Feed use shows how many resources support animal production. Acidification and eutrophication reveal pollution pressures that carbon totals cannot show.
This creates a better question than simply asking whether meat is good or bad. The useful question is: which part of your consumption creates the largest estimated impact?
That question can lead to a practical decision. A household may discover that one meat category dominates its total. A student may compare several dietary scenarios. A sustainability team may use the results for an early screening exercise before a deeper assessment.
The calculator does not need to tell you what to eat. It gives you a consistent way to compare scenarios. You remain in control of the decision.
Carbon, Water, Land, Feed and Pollution Tell Different Stories
A common problem appears when users focus only on carbon. A lower carbon result does not automatically describe every environmental pressure.
Carbon dioxide equivalent combines the warming effects of greenhouse gases into one comparable measure. This makes different greenhouse gases easier to evaluate together.
Water footprint addresses water associated with production. It is broader than the water an animal directly drinks. Feed production can represent an important part of the total.
Land use considers the land connected with production. This may include grazing and land used for animal feed. The result helps explain why production systems with different feed and land needs can show very different footprints.
Feed requirement adds another practical layer. Animals convert feed into food with different efficiencies. That affects the resources needed for a given amount of meat.
Acidification potential concerns emissions that can contribute to environmental acidification. Eutrophication potential concerns nutrient enrichment that can damage aquatic systems. These indicators are different from climate impact.
Reading them together gives a more balanced picture. It also prevents one attractive number from hiding another environmental trade-off.
Why Meat Type Can Change the Result So Quickly
Imagine two households eating the same total meat weight. One consumes more beef. The other consumes more poultry. Their totals can differ sharply because the calculator assigns different factors to each meat type.
This is why accurate categorization matters. Entering all meat as one generic quantity removes information that the model needs.
The practical workflow is simple. Estimate the quantity of each meat separately. Keep the time basis consistent. Then compare the contribution of each category.
Do not focus only on the largest raw consumption value. The largest environmental contribution can come from a smaller quantity with a larger impact factor.
How Does Meat Consumption Affect Carbon, Water and Land?
A shopping receipt tells you price and weight. It does not show methane, agricultural water demand, land occupation, or nutrient pollution. Those impacts occur throughout production.
Livestock systems require animals, feed, land, water, infrastructure, energy, and processing. Ruminant animals also produce methane through digestion. Manure management can contribute further emissions. Feed production can require fertilizer, water, energy, and land.
This is why a life-cycle view is useful. It moves the discussion beyond what happens at the supermarket. It asks what was required before the product reached the consumer.
Why Beef Often Dominates a Meat Footprint
One of the most useful insights appears when several meats are compared on the same basis. Beef often creates a much larger estimated impact per kilogram than poultry or pork.
There are several reasons. Cattle are ruminants. Their digestive process produces methane. Cattle production can also require substantial land and feed resources. Production cycles and land-use conditions add further variation.
This does not mean every kilogram of beef has an identical footprint. Farms are not identical factories. Feed systems differ. Geography differs. Land management differs. Productivity differs.
That variation is important. It means a calculator result should be read as an estimate based on representative factors. It should not be presented as a measured environmental audit of a specific steak.
Still, averages remain useful for scenario comparison. If the same method is applied consistently, users can see which dietary changes are likely to have the largest effect on the estimate.
Chicken, Pork, Lamb and Fish Are Not Interchangeable
A second mistake is placing every non-beef meat into one “lower impact” group. That hides meaningful differences.
Lamb is also a ruminant meat. Pork and poultry use different production systems. Fish is especially diverse because species and production methods vary widely.
A useful calculator therefore keeps the categories separate. This improves both transparency and decision quality.
When comparing foods, use the same basis. Compare one kilogram with one kilogram, or equivalent consumption periods with each other. Switching between weight, serving size, and time period without proper conversion creates misleading conclusions.
How Should You Read Carbon Dioxide Equivalent?
A user sees “kg CO2e” and may assume the calculator counted carbon dioxide alone. That interpretation is incorrect.
CO2e means carbon dioxide equivalent. It provides a common climate unit for greenhouse gases with different warming effects. This allows emissions such as methane and nitrous oxide to be represented alongside carbon dioxide.
This is especially useful in food systems. Livestock production can involve several greenhouse gases. Reporting them through a common equivalent makes comparison easier.
Why Carbon Is Useful but Cannot Tell the Whole Story
A carbon result is easy to communicate. That convenience can become a weakness when users treat it as a complete environmental score.
Suppose two options produce similar carbon results. Their water or land demands may still differ. Pollution indicators may also tell different stories.
AxiCalculator therefore treats carbon as one output within a wider environmental picture. This helps users avoid false precision and one-dimensional decisions.
Why Methane Matters in Livestock Analysis
Ruminant livestock release methane during digestion. This is one reason cattle and sheep require careful treatment in climate comparisons.
However, a user does not need to manually calculate each greenhouse gas. The CO2e factor combines climate effects into a usable coefficient for the calculator.
The important step is interpretation. A calculated CO2e value is an estimate based on the factor used. It is not a direct measurement from the exact farm that supplied the food.
Why Does the Water Footprint of Meat Look So Large?
A user may look at a water result and ask a reasonable question: how could an animal possibly drink that much water?
The answer is that a production water footprint is not simply drinking water. Water can also be associated with growing feed and other stages of production.
This distinction matters. Without it, large water-footprint values appear impossible. With it, the number becomes easier to interpret.
Water Footprint Is a Production Indicator, Not a Water Bill
Do not read a water footprint as the amount of tap water poured directly into an animal’s trough. It represents a broader accounting concept.
Water conditions also vary by region. The environmental meaning of water use can differ between a water-rich location and a water-stressed location.
For that reason, a general calculator is useful for broad comparison. A location-specific water assessment requires more detailed information.
Why Does Land Use Matter When Comparing Meat?
Carbon gets attention because it has one familiar unit. Land pressure is less visible, yet it can be substantial.
Livestock production can require grazing land and cropland for feed. The amount depends on the animal, production system, productivity, and local conditions.
A land-use result helps expose this hidden resource demand. It is especially valuable when comparing meat categories that require different production pathways.
Land Demand Connects Diet With the Wider Food System
Land is not only a quantity. It is also a competing resource. Agriculture, ecosystems, settlements, forests, and other uses can compete for available land.
This is why land results should not be interpreted as an isolated number. They are an indicator of resource demand within a larger system.
For personal decisions, the most useful approach is comparative. Keep your total food scenario consistent. Change one meat quantity. Then observe how the estimated land result responds.
What Do Air and Water Pollution Results Actually Mean?
Some users reach the pollution outputs and stop. The units look unfamiliar. Yet these outputs add information that carbon cannot provide.
Acidification Shows a Different Environmental Pressure
Acidification potential represents emissions that can contribute to increasing environmental acidity. Agricultural emissions linked with livestock and manure can contribute to this pressure.
The value should be treated as an impact indicator. It does not mean that the listed mass of acid was physically poured into the environment.
Eutrophication Helps Explain Nutrient Pollution
Excess nutrients can stimulate excessive biological growth in aquatic systems. That process can damage water quality and ecosystems.
Agricultural nutrient losses can contribute to this problem. Feed production and manure management are relevant parts of the wider system.
For users comparing dietary scenarios, the important insight is simple. Climate impact and nutrient pollution are separate dimensions. A complete comparison should not silently treat them as the same thing.
How Can You Compare Beef, Chicken, Pork, Lamb and Fish Fairly?
A comparison fails when one meat is measured per kilogram and another per serving. The first rule is therefore consistency.
Choose a common consumption basis. Enter comparable quantities. Use the same result period. Then inspect the environmental outputs together.
Start With the Category Driving the Largest Result
Users often try to optimize everything at once. That makes the result harder to act on.
Instead, identify the meat category contributing most to the metric you care about. Then test one change.
For example, reduce that category while keeping all others constant. The calculator updates the scenario. You can now see the marginal effect of that single change.
This approach turns the calculator into a decision tool rather than a score generator.
How Can You Use the Calculator to Test a Diet Change?
The hardest sustainability question is often not “What is my footprint?” It is “Which realistic change matters most?”
Scenario testing answers that question more clearly.
Compare Before and After Instead of Chasing a Perfect Diet
Enter your current pattern first. Record the outputs that matter to you. Then change one consumption value.
You might reduce weekly beef while leaving other foods unchanged. You might compare a lower-meat week with your normal week. You might test different meat mixes while keeping total meat weight constant.
Each scenario answers a different question. The calculator helps quantify the direction and size of the estimated change.
This process is more useful than choosing a target without understanding what drives the baseline.
Why Can Your Real Meat Footprint Differ From the Estimate?
A precise-looking result can create false confidence. Real agricultural systems vary far more than a single coefficient can show.
Production location matters. Feed matters. Farming practices matter. Animal productivity matters. Land management matters. Processing and supply-chain conditions can also differ.
Average Factors Are Powerful for Comparison but Limited for Auditing
Average coefficients solve an important problem. Most consumers do not know the complete life-cycle inventory for every food they purchase.
Using consistent average factors makes personal scenario analysis possible. It allows two consumption patterns to be compared under one methodology.
However, the same average cannot prove the exact footprint of a specific producer. A company making environmental claims about a particular product needs product-specific evidence.
This distinction protects both scientific accuracy and user trust.
More Decimal Places Do Not Create Better Environmental Data
Users sometimes assume a longer result is automatically more accurate. It is not.
Mathematical precision and real-world certainty are different concepts. A calculation can be numerically precise while its environmental coefficient represents a broad average.
The best interpretation therefore combines a reliable calculation with an honest understanding of model limits.
Who Benefits Most From a Meat Footprint Calculator?
A household wants a simple answer. A student needs a transparent method. A sustainability professional may need an early screening tool. The same calculator can serve all three when its limits are clear.
Households Can Find High-Impact Habits Quickly
Personal users can enter typical weekly consumption and compare scenarios. This makes an invisible environmental cost easier to understand.
Students Can Explore Environmental Relationships
Students can change one input at a time and observe the response. This demonstrates how consumption quantities and environmental factors interact.
Sustainability Teams Can Use It for Early Screening
Professionals can use the calculator for quick exploratory comparisons. It can help identify questions that deserve deeper investigation.
It should not replace a verified product life-cycle assessment, supplier-specific inventory, regulatory method, or formal corporate accounting process.
How Do You Turn a Meat Footprint Result Into a Better Decision?
The final result is not the end of the process. It is the start of a comparison.
First, identify the metric that matters to your goal. Carbon may be your priority. Water may matter more in another context. Land or nutrient pollution may be important for a broader environmental review.
Second, find the meat category that contributes most strongly. Third, test a realistic adjustment. Finally, compare the new result with the baseline.
Use AxiCalculator as a Scenario Tool, Not a Judgment Tool
A useful environmental calculator should clarify choices rather than dictate them. AxiCalculator is designed around that principle.
You can compare meat types, consumption levels, time periods, and compatible units. You can explore how changes affect several environmental indicators instead of relying on one headline number.
The strongest decision is rarely the one with the most decimals. It is the one where you understand what changed, why the result changed, and which assumptions sit behind it.
That is the real value of a Meat Footprint Calculator: turning an invisible production impact into a comparison you can understand and use.
Frequently Asked Questions
Can I calculate my meat footprint if I do not know exact weights?
Should I focus on carbon or the total environmental footprint?
Can the calculator show whether reducing one meat matters more than another?
Why does my result differ from the footprint printed on a food product?
How should an engineer validate a meat-footprint result for a real project?
Why can reverse solving fail even when the target result is numerically valid?
How should uncertainty be handled when comparing two close meat-footprint results?
Engineering Resources
Our engineers are here to help you get it right.