Hand Drying Footprint Calculator
- Last formula update:

Decimal & Rounding Policy
- All intermediate calculations retain full floating-point precision without step-by-step rounding.
- Displayed carbon footprint values may be rounded to a practical readable precision.
- Tree estimates may show additional decimals when the result is below one tree.
- Paper towel totals preserve calculated decimals unless a whole-item presentation is required.
- Reverse calculations use unrounded internal values, preventing accumulated rounding errors.
- Unit conversions occur before display rounding, so changing units preserves the physical value.
Valid range
- Number of staff must be a whole number equal to or greater than zero.
- Customer count must be zero or greater and represent average facility traffic.
- Hand drying frequency must be greater than zero for every active user group.
- Drying time, towel usage, or cotton-roll usage intensity must be greater than zero.
- Carbon footprint, towel demand, and tree-related results cannot be negative.
- Reverse solving requires enough known parameters to determine exactly one unknown value.
- Only units dimensionally compatible with the selected parameter are accepted.

Tivessa Zorquell
Reviewers:
Veralisse Noxmere
Sarven Kestthorne
Check our editorial policy
September 13, 2026
1.0.0
Initial calculator and formula release.
Our engineers are here to help you get it right.
What Can a Hand Drying Footprint Calculator Tell You About Your Facility?
Hand Drying Footprint Calculator results turn everyday restroom activity into an annual environmental estimate. It combines the selected drying system with usage frequency and facility activity so you can compare realistic operating scenarios instead of relying on a generic claim about paper towels or electric dryers.
- Estimate annual hand-drying carbon footprint from real usage patterns.
- Compare electric dryers, paper towels, recycled towels, and cotton systems.
- Separate staff activity from customer or visitor restroom traffic.
- See how drying time or towels per dry changes the result.
- Estimate annual paper towel demand for paper-based systems.
- View tree-equivalent indicators for carbon absorption and paper demand.
- Use reverse solving to work backward from a carbon target.
- Keep the same usage scenario when comparing different drying technologies.
The Hand Drying Footprint Calculator is most useful for screening, facility planning, sustainability comparisons, and operational improvement. Real environmental performance can vary with equipment, electricity supply, manufacturing, transport, user behavior, maintenance, and waste treatment, so major decisions should also consider verified site-specific information.
Assumptions used in this calculator
- Results assume stable hand-drying behavior throughout the selected calculation period.
- Annual estimates use 365 days unless a frequency unit converts differently.
- Carbon factors represent lifecycle averages, not site-specific measured emissions.
- Electric dryer impacts vary with model power, runtime, and electricity mix.
- Paper towel impacts vary with manufacturing, transport, use, and disposal.
- Recycled and virgin towels use distinct lifecycle impact factors.
- Paper towel demand scales with towels used per hand-drying event.
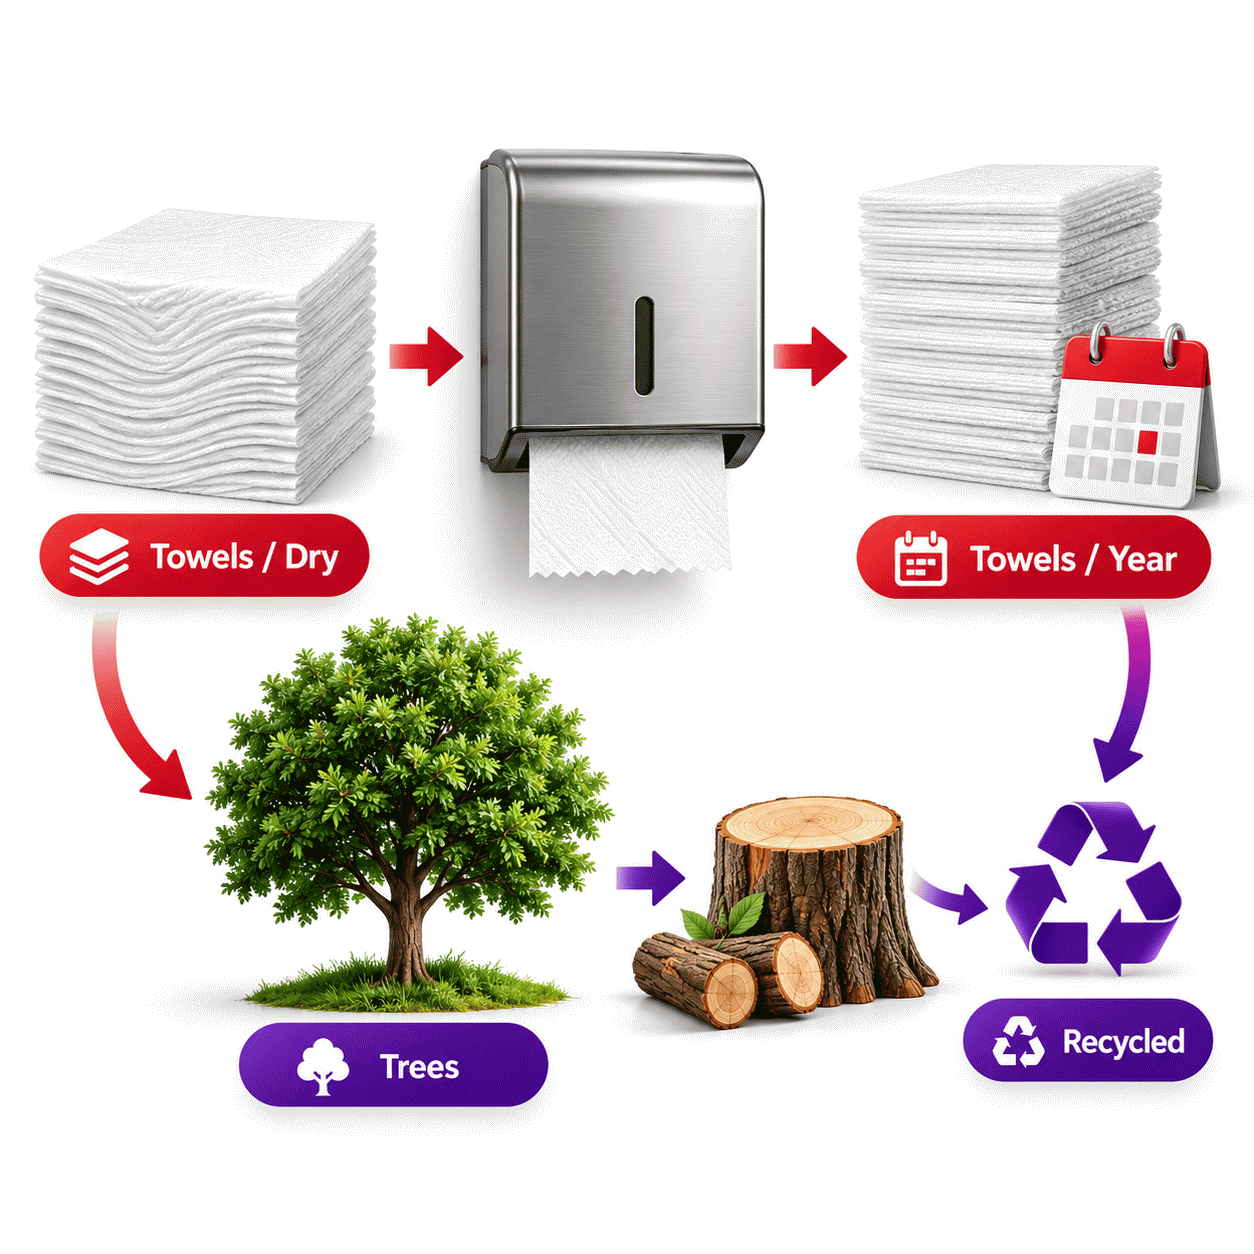
- Tree-production estimates use approximately 25,000 paper towels per average tree.
- Tree absorption estimates use a fixed annual carbon uptake factor.
- Facility calculations assume staff and customer activity are statistically representative.
- Reverse solving requires enough known values to determine one unknown uniquely.
- Intermediate calculations retain full precision and round only displayed results.
- Outputs support planning, comparison, sustainability screening, and educational analysis.
Results are rounded for display.
Internal calculations use full precision.
Formulas Used in Hand Drying Footprint Calculator :
Daily Hand-Drying Events
Adjusted Global Warming Potential per Dry
Annual Carbon Footprint
Annual Paper Towel Demand
Trees Needed to Absorb the Annual Carbon Footprint
Trees Required for Paper Production
Reverse Carbon Solving
Reverse Facility Solving
Reverse Paper Usage Solving
D = average hand-drying events per day.
fi = individual hand-drying frequency per day.
Ns = number of staff.
fs = staff hand-drying frequency per person per day.
Nc = average customers or visitors per day.
fc = customer hand-drying frequency per visit.
I = selected drying intensity, such as seconds, pulls, or towels per dry.
I0 = baseline intensity associated with the selected drying system.
g0 = baseline lifecycle global warming potential in grams CO2e per dry.
g = intensity-adjusted global warming potential in grams CO2e per dry.
E = annual carbon footprint in kilograms CO2e.
Ty = annual paper towel demand.
A = estimated trees needed to absorb the annual carbon footprint.
Ct = estimated trees associated with annual paper towel production.
ka = annual carbon absorption factor per tree, 21.77 kg CO2 per year.
kt = paper production factor, approximately 25,000 towels per average tree.
Variables & Definitions
View a complete list of all variables used in this calculator, including definitions and units
Hand Drying Footprint Calculator Variables and Symbols
| Symbol | Variable | Base Unit | Role in Calculation |
|---|---|---|---|
| D | Daily hand-drying events | dries/day | Total average drying events generated each day. |
| fi | Individual drying frequency | dries/day | Daily drying frequency used in individual mode. |
| Ns | Number of staff | people | Staff population included in facility calculations. |
| fs | Staff drying frequency | dries/person/day | Average daily drying frequency for each staff member. |
| Nc | Customers or visitors | people/day | Average daily customer or visitor traffic. |
| fc | Customer drying frequency | dries/visit | Average drying events generated by each visitor. |
| I | Selected use intensity | seconds, pulls, or towels/dry | Actual usage intensity selected for the drying system. |
| I0 | Baseline use intensity | seconds, pulls, or towels/dry | Reference intensity corresponding to the baseline lifecycle factor. |
| g0 | Baseline global warming potential | g CO2e/dry | Lifecycle impact factor for the selected drying system. |
| g | Adjusted global warming potential | g CO2e/dry | Impact per drying event after intensity adjustment. |
| E | Annual carbon footprint | kg CO2e/year | Total estimated annual lifecycle climate impact. |
| Ty | Annual paper towel demand | towels/year | Annual towel requirement when a paper towel system is selected. |
| A | Trees needed for carbon absorption | trees | Tree-equivalent annual carbon absorption estimate. |
| Ct | Trees associated with paper production | trees | Tree-equivalent estimate derived from annual paper towel demand. |
| ka | Annual tree carbon absorption factor | 21.77 kg CO2/tree/year | Conversion factor used for the tree absorption estimate. |
| kt | Paper towels per average tree | 25,000 towels/tree | Conversion factor used for paper-production tree equivalents. |
Unit Conversion Table
Hand Drying Footprint Calculator Unit Conversion Table
| Unit Group | Unit Name | Symbol | Equivalent in Base Unit | Used For |
|---|---|---|---|---|
| Drying Frequency | Per day | /day | 1 /day | Individual and staff hand-drying frequency |
| Drying Frequency | Per week | /week | 1/7 /day | Individual and staff hand-drying frequency |
| Drying Frequency | Per year | /year | 1/365 /day | Individual and staff hand-drying frequency |
| People and Traffic | Person | person | 1 person | Number of staff |
| People and Traffic | People per day | people/day | 1 person/day | Customers or visitors |
| Drying Time | Second | s | 1 second | Electric hand dryer use intensity |
| Cotton Roll Usage | Pull per dry | pull/dry | 1 pull/dry | Cotton roll towel use intensity |
| Paper Towel Usage | Towel per dry | towel/dry | 1 towel/dry | Paper towel use intensity |
| Paper Towel Usage | Towels per day | towels/day | 365 towels/year | Daily paper towel demand |
| Paper Towel Usage | Towels per year | towels/year | 1 towel/year | Annual paper towel demand |
| Carbon Footprint | Kilogram CO2 equivalent | kg CO2e | 1 kg CO2e | Annual carbon footprint |
| Carbon Footprint | Gram CO2 equivalent | g CO2e | 0.001 kg CO2e | Carbon footprint and lifecycle impact factors |
| Carbon Footprint | Metric tonne CO2 equivalent | t CO2e | 1,000 kg CO2e | Large annual carbon footprints |
| Carbon Footprint | Milligram CO2 equivalent | mg CO2e | 0.000001 kg CO2e | Very small carbon quantities |
| Tree Equivalent | Tree equivalent | tree | 1 tree | Carbon absorption and paper production estimates |
Example Calculation
Trees needed to absorb the annual footprint: about 7.90 trees
Annual paper towel demand: 21,900 towels
Trees associated with paper production: about 0.876 trees
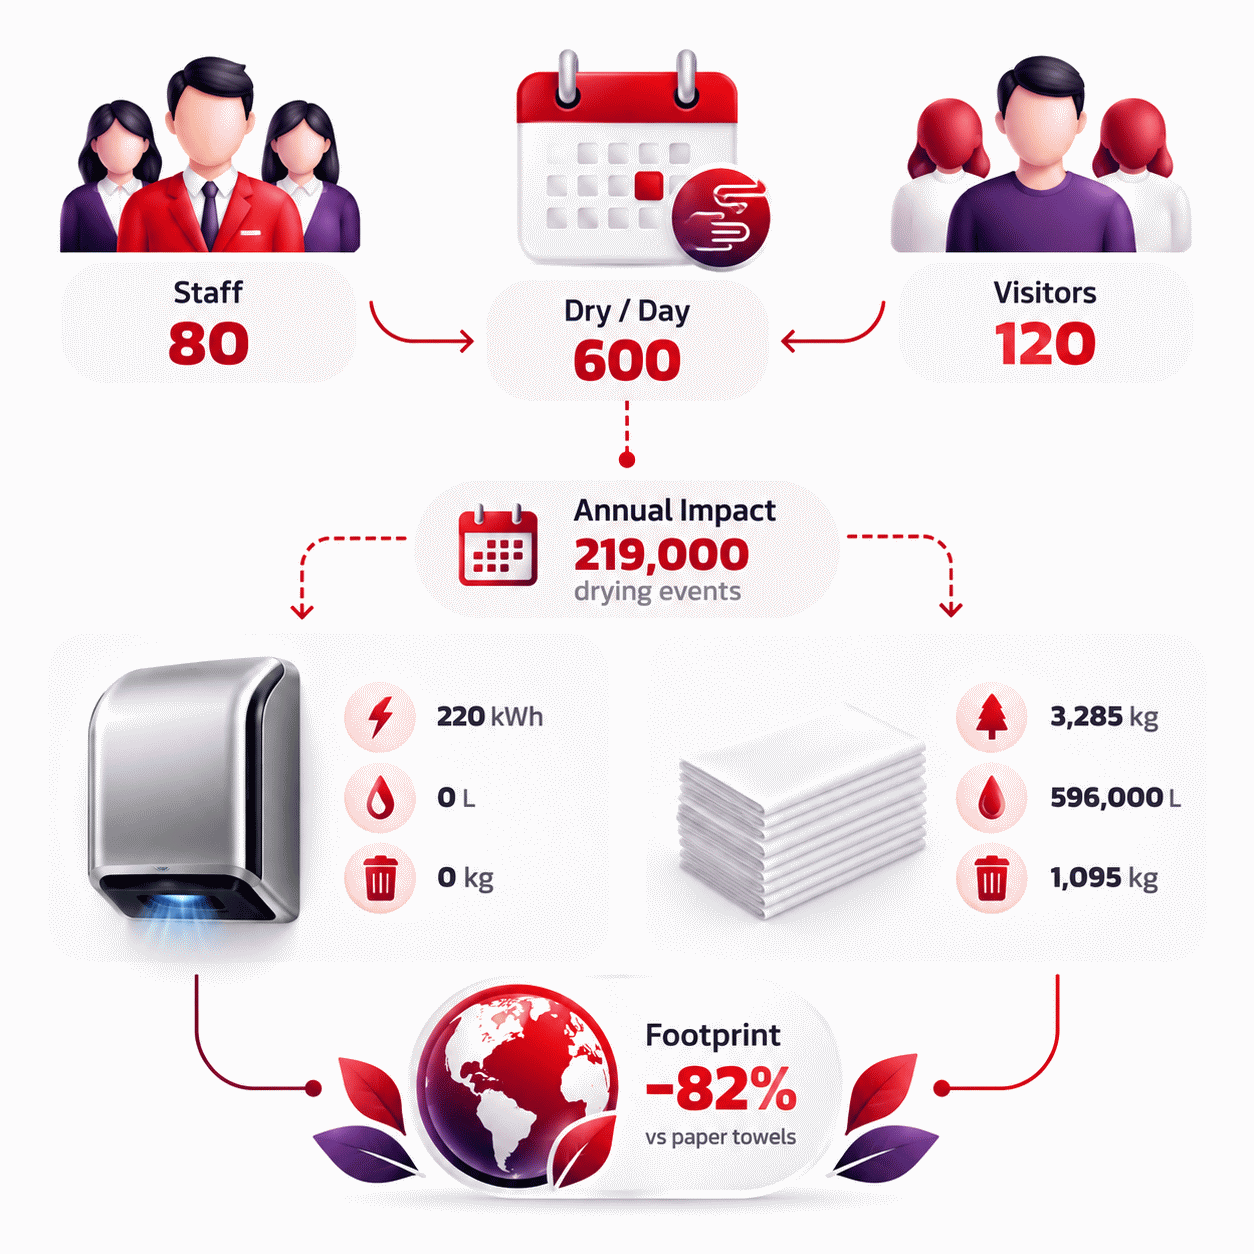
Daily hand-drying events: 40
Annual carbon footprint: 229.22 kg CO2e
Annual paper towel demand: 29,200 towels
Trees needed for carbon absorption: about 10.53 trees
Trees associated with paper production: about 1.168 trees
Results are rounded for display.
Internal calculations use full precision.
Calculations Disclaimer
This Hand Drying Footprint Calculator provides estimated environmental impacts based on lifecycle assessment factors, selected hand-drying systems, usage frequency, and user-supplied operating conditions. Actual carbon emissions may differ because equipment power, drying duration, electricity generation mix, paper manufacturing, transportation, dispenser configuration, waste handling, user behavior, maintenance, and local operating conditions vary between facilities. Tree-related values are approximate environmental equivalents rather than measurements of actual trees planted, removed, or guaranteed to absorb a specific quantity of emissions. Results are intended for educational, planning, comparison, sustainability screening, and preliminary decision-support purposes and should not replace a site-specific lifecycle assessment, environmental audit, engineering study, regulatory calculation, or professional sustainability assessment.
What Does a Hand Drying Footprint Calculator Actually Tell You?
A busy restroom can create thousands of drying events before anyone notices the accumulated impact. A Hand Drying Footprint Calculator turns that repeated activity into useful environmental data. The Hand Drying Footprint Calculator connects facility usage with the selected drying system and estimates its annual climate impact.
The key value is scale. One drying event looks insignificant. Hundreds of users repeating the same action every day create a very different picture. A facility manager can therefore move beyond guesses and compare options under the same operating conditions.
The result is useful for offices, schools, shopping centers, restaurants, factories, transport facilities, public buildings, and other shared washrooms. Instead of asking whether one method is universally better, the better question is which method performs better under the conditions that actually matter to the facility.
Why Daily Hand-Drying Frequency Changes the Annual Result
A common planning problem is underestimating usage. Ten extra drying events seem trivial. Repeated every day, they become thousands of additional events per year.
Usage frequency therefore deserves careful attention. Individual users can be modeled from their average daily frequency. Facilities can separate staff activity from customer or visitor activity. This is useful because employees and visitors rarely have identical attendance patterns.
A realistic usage estimate creates a better environmental comparison. A precise equipment factor cannot rescue an unrealistic traffic assumption.
How Facility Traffic Turns Small Choices Into Large Environmental Loads
Imagine a small office and a transport terminal using the same drying system. The equipment may be identical, but their annual environmental totals can be dramatically different. Traffic is the multiplier.
This is why facility-scale analysis should start with activity. Count or estimate staff, visitors, and drying frequency. Then compare technologies while holding that activity constant. This isolates the effect of the drying method rather than mixing technology changes with traffic changes.
What CO2e per Hand Dry Really Means
Facility teams often see a carbon number without knowing what it represents. CO2e means carbon dioxide equivalent. It provides a common climate-impact measure for greenhouse gases.
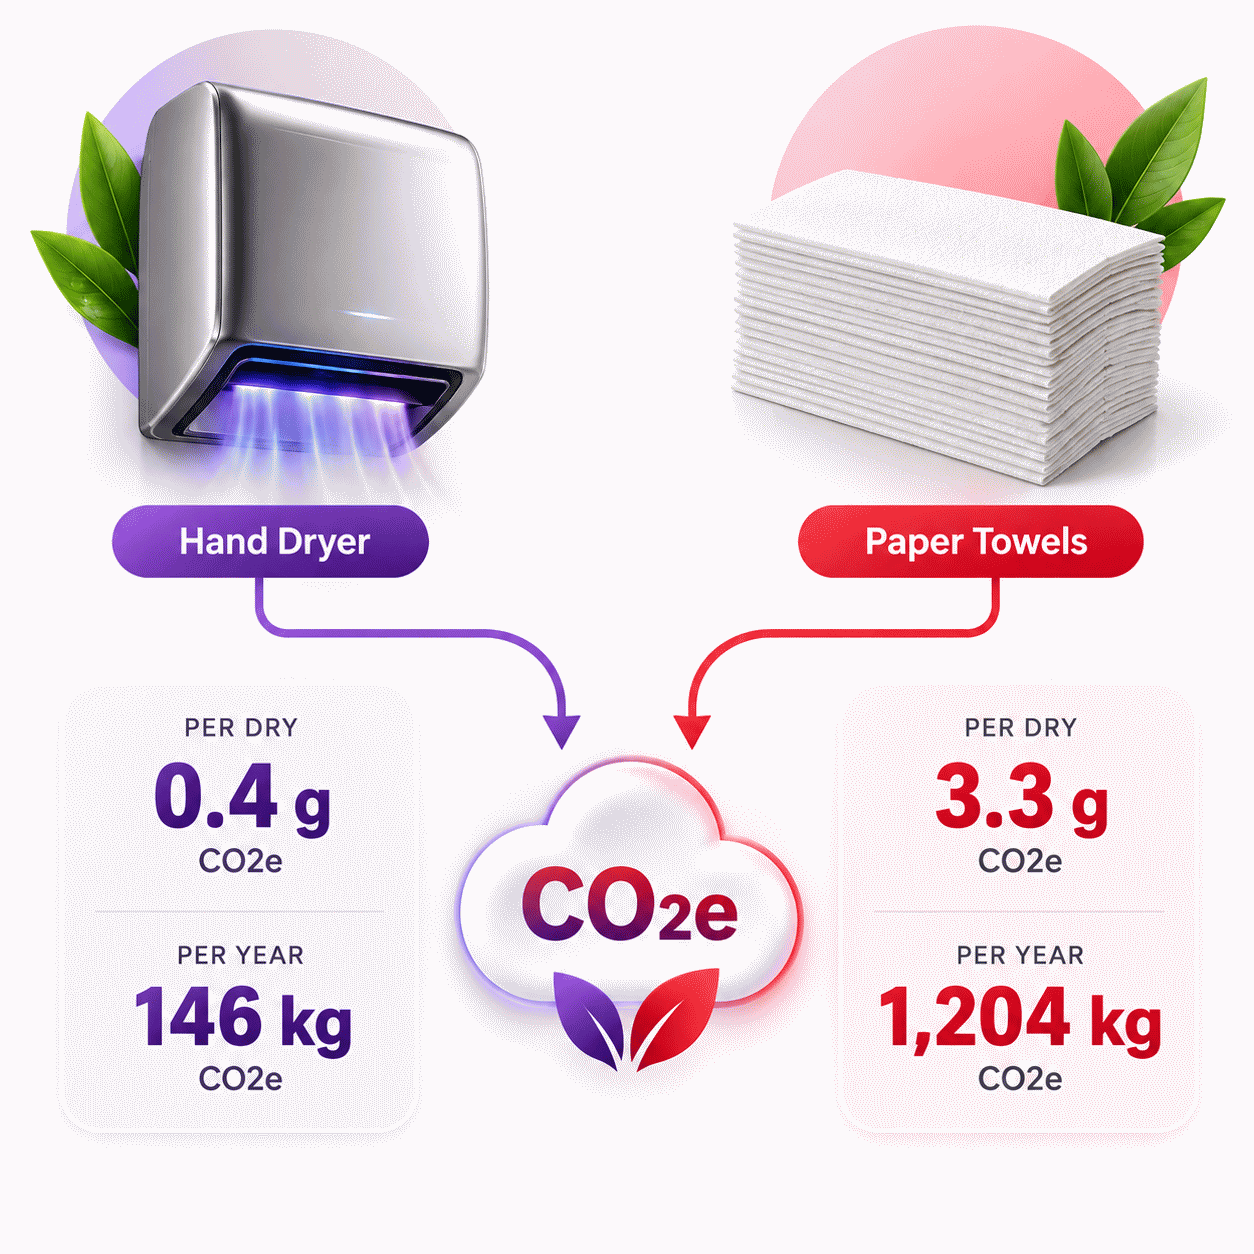
A per-dry lifecycle value can include more than electricity used at the wall. Depending on the underlying assessment, it can reflect manufacturing, materials, operation, transport, consumables, and end-of-life processes.
This distinction matters. Comparing only electricity consumption with an entire paper supply chain is not a balanced comparison. Both options should be evaluated using compatible system boundaries.
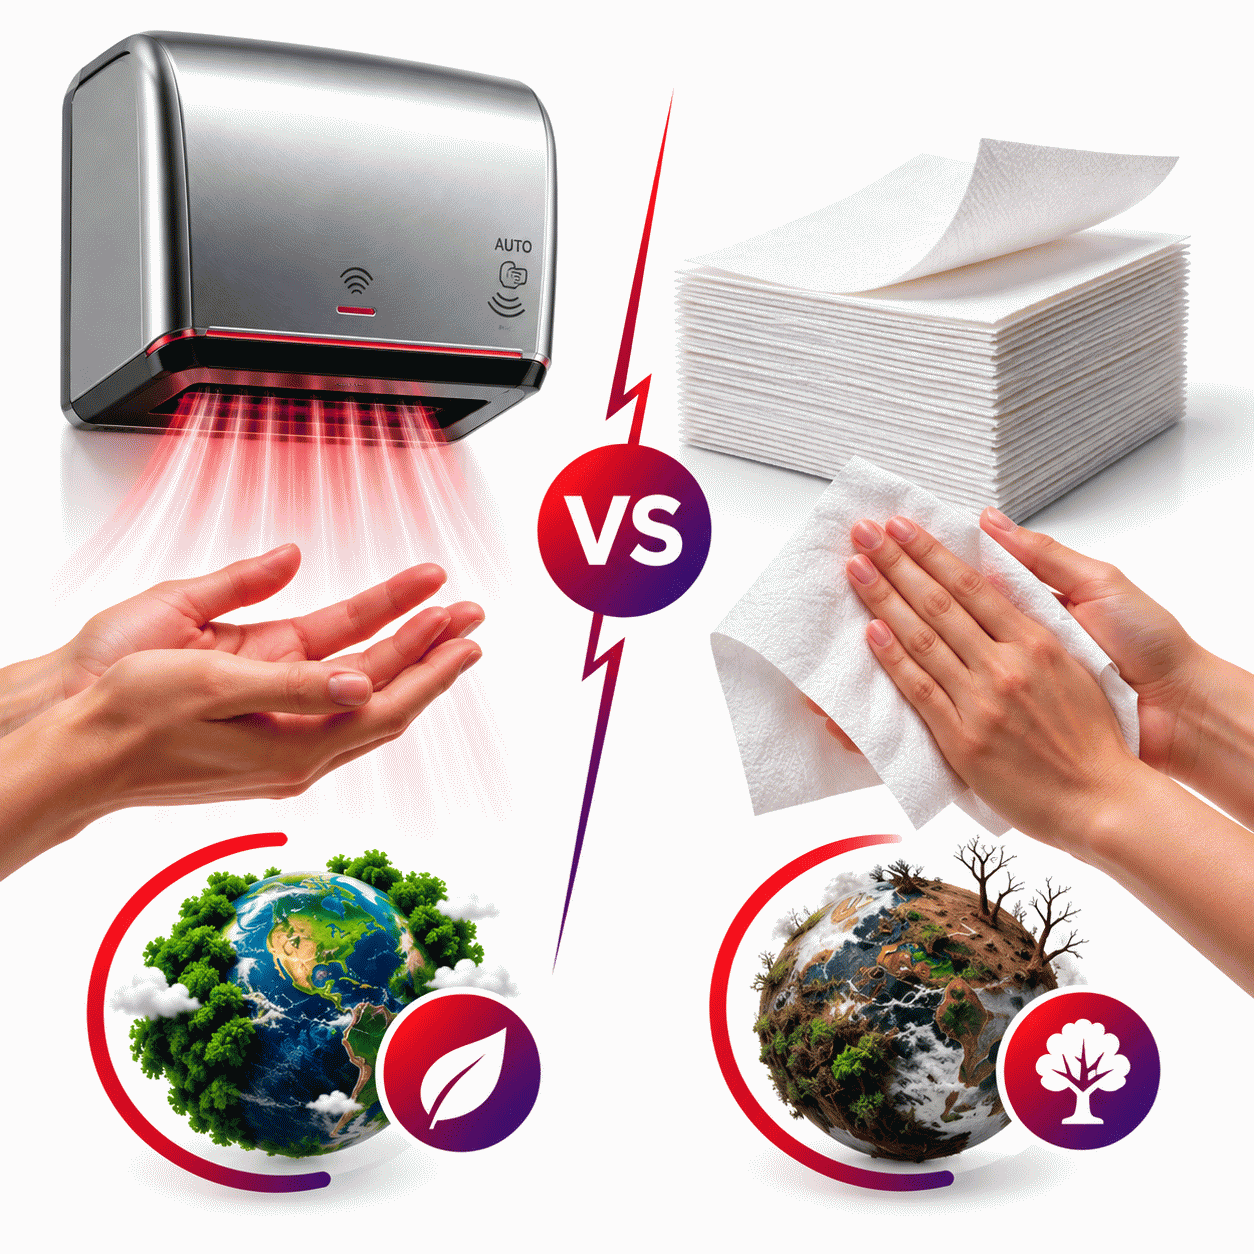
Hand Dryer vs Paper Towels: Which Choice Has the Lower Footprint?
The frustrating answer is also the scientifically useful one: the result depends on the system and assumptions. A modern high-speed dryer does not behave like an older warm-air dryer. Recycled towels do not necessarily share the same lifecycle profile as virgin towels. User behavior changes both technologies.
The safest comparison keeps the required service constant: the same number of dry hands. Only then should the drying system change.
This approach avoids a common mistake. A comparison becomes misleading when one scenario assumes short dryer use while another assumes excessive paper consumption. Consistent service conditions make the result easier to defend.
How Electric Hand Dryers Create an Environmental Footprint
An electric dryer can look almost impact-free because no disposable material leaves the dispenser. That view misses part of the system.
The dryer has manufacturing impacts. It consumes electricity during operation. Its service life matters. Maintenance and eventual disposal also belong to a complete lifecycle perspective.
For many electric systems, operating conditions strongly influence performance. Drying duration is especially important. A machine that runs much longer than expected can consume more energy per completed dry.
Why Dryer Type and Drying Time Matter
Two machines installed beside each other can provide the same service with different power and runtime characteristics. High-speed systems aim to remove water quickly. Traditional warm-air systems may rely on longer airflow and heating.
Runtime should therefore represent actual use rather than a convenient marketing number. Sensor behavior, user technique, repeat cycles, and incomplete drying can all influence real operation.
For procurement teams, rated power alone is not enough. Power must be interpreted together with runtime and the broader lifecycle profile.
High-Speed Dryers vs Standard Warm-Air Dryers
A replacement project often starts because an older dryer feels slow. That operational problem can also have an environmental dimension.
High-speed systems can complete a drying event more quickly. Older warm-air systems may operate longer. Yet the correct comparison is not simply “new versus old.” Equipment lifetime, power demand, use intensity, and the environmental profile of electricity should all be considered.
The calculator makes this comparison easier by keeping facility demand stable while changing the selected system.
How Electricity Supply Can Change the Real-World Outcome
A dryer installed in two regions may consume the same electrical energy but cause different electricity-related emissions. Electricity generation varies by location and time.
This is one reason lifecycle results should be interpreted as estimates rather than universal constants. A screening calculator can provide a consistent reference scenario. A major industrial decision may justify replacing general assumptions with verified local data.
How Paper Towels Create an Environmental Footprint
A paper towel disappears into a bin within seconds, but its lifecycle began much earlier. Raw material production, processing, converting, packaging, transport, dispensing, and waste management can all contribute to environmental impact.
Consumption is especially important. A dispenser does not control how many towels every user takes. One user may take one sheet. Another may take several. Across a large facility, that behavioral difference can become substantial.
Virgin vs Recycled Paper Towels
“Recycled” can sound like a complete environmental answer. It is not. Recycled products still require collection, processing, manufacturing, transport, and disposal.
Virgin and recycled towels should therefore be treated as different product systems rather than assuming one universal towel factor. Their environmental profiles depend on manufacturing conditions and lifecycle assumptions.
For purchasing teams, recycled content is one attribute. Supplier evidence, product performance, sheet consumption, logistics, and waste practices also matter.
Why Towels per Dry Can Change Annual Consumption Fast
A dispenser setting that causes users to take an extra towel can look harmless. Annual arithmetic tells another story.
If a facility performs thousands of drying events, every additional towel per event multiplies across the entire year. This makes towels per dry one of the most actionable operating variables.
Reducing unnecessary towel use can therefore be worth testing before replacing an entire system. Better dispensing and user behavior may reduce material demand without changing the underlying service.
What Happens After a Used Paper Towel Enters the Waste Stream?
The environmental story does not necessarily end at the restroom bin. Used towels must be collected and treated within a waste-management system.
Waste routes differ by location. That means end-of-life assumptions can affect lifecycle comparisons. A general calculator is useful for screening, but a detailed organizational inventory should use the facility’s actual waste pathway when that information is available.
How to Compare Hand-Drying Systems for a Real Facility
A purchasing team can easily compare two technologies unfairly. One scenario may use optimistic traffic while another uses actual traffic. The resulting difference says little about the equipment itself.
Begin with one shared demand scenario. Record staff, visitors, and typical drying frequency. Select one system and calculate its impact. Then change the drying technology without changing facility activity.
This creates a cleaner comparison. The difference is more likely to reflect the technology rather than unrelated assumptions.
Start With Staff, Visitors and Daily Restroom Traffic
A factory, school, office, and shopping center can have very different usage patterns. Even two buildings with the same daily visitor count may behave differently.
Employees may use facilities repeatedly throughout a shift. Customers may visit only once. Separating these populations provides a more useful demand estimate than applying one generic frequency to everyone.
Compare Methods Without Changing the Usage Scenario
Once demand is established, keep it fixed. Change the drying system and observe the result. Then test realistic changes in use intensity.
This sequence helps decision-makers see which variable causes the change. It also makes the analysis easier to explain to sustainability teams, procurement staff, and management.
Why Changing Several Inputs at Once Can Mislead You
Changing technology, traffic, usage intensity, and operating assumptions simultaneously creates an attribution problem. You can see that the result changed, but not why.
A better method changes one major assumption at a time. This simple sensitivity approach reveals which inputs deserve better measurement.
How Reverse Solving Helps With Carbon Reduction Planning
Some sustainability projects begin with a target, not an activity estimate. Management may know the maximum footprint it wants to accept but not the operating level that fits the target.
Reverse solving turns the calculation around. Instead of asking what footprint current usage creates, it asks what usage corresponds to a chosen environmental result.
This is especially useful for scenario planning because outputs and inputs become part of the same mathematical relationship.
Start With an Annual Carbon Target Instead of Usage
Suppose a team has a defined annual hand-drying footprint target. The target can be converted back into the number of drying events compatible with the selected system.
The result does not automatically become an operational recommendation. It becomes a planning boundary. Teams can compare that boundary with observed traffic and decide whether equipment, behavior, or another assumption needs attention.
Find the Unknown Facility Input From Known Operating Data
A facility may know customer traffic, staff count, and customer behavior while lacking a reliable staff drying-frequency estimate. Reverse solving can determine the missing variable when the remaining quantities are known.
The same principle can work for another single unknown. The key condition is mathematical identifiability: enough independent information must exist to solve one unknown uniquely.
What Facility Managers Should Check Before Changing Drying Systems
A low calculated footprint does not automatically make a system suitable for every building. Procurement decisions have more constraints than carbon alone.
Check expected traffic, electrical requirements, maintenance access, reliability, noise, accessibility, cleaning procedures, consumable storage, waste handling, user acceptance, and applicable hygiene policies.
Environmental performance belongs inside that decision, not outside it.
Environmental Performance Is Only One Part of the Decision
A technically attractive result can fail if the selected system performs poorly in its real environment. High-traffic sites need adequate throughput. Quiet buildings may care about acoustic performance. Facilities with specific hygiene requirements may have additional constraints.
The calculator should therefore support a decision rather than replace professional facility assessment.
Maintenance, Reliability and User Behavior Matter Too
A poorly maintained system can change user behavior. People may repeat drying cycles, abandon the dryer early, or consume more towels than expected.
That means maintenance can indirectly influence environmental performance. Procurement teams should examine serviceability and expected real-world operation alongside lifecycle metrics.
When Site-Specific Data Becomes More Valuable Than Defaults
Defaults are useful when a project is still being screened. Their value declines as the financial or environmental importance of the decision rises.
Large facilities can improve confidence by measuring restroom traffic, observing typical drying behavior, checking actual equipment specifications, reviewing electricity data, and recording consumable purchasing volumes.
How to Reduce the Environmental Impact of Hand Drying
The most expensive solution is not always the first solution worth testing. Some facilities can reduce impact by correcting avoidable consumption.
For paper systems, inspect dispensing behavior and towels per dry. For electric systems, examine actual runtime, maintenance condition, and user behavior. In both cases, measure demand before and after the intervention.
Reduce Avoidable Consumption Before Replacing Equipment
Operational waste is often easier to address than infrastructure. A dispenser that releases excessive material can be investigated immediately. A dryer that causes repeated cycles may need maintenance or adjustment.
These observations create useful purchasing evidence. If operational fixes cannot reach the target, the organization has a stronger basis for evaluating replacement.
Measure the Result Again After Operational Changes
A sustainability action is more useful when its effect can be checked. Record the original scenario, implement the change, and calculate the revised scenario using comparable assumptions.
This creates a simple before-and-after framework. It also prevents environmental claims from relying only on expectation.
Turn Hand-Drying Data Into a Practical Sustainability Decision
The useful question is not whether paper towels or electric dryers are universally “green.” Real facilities operate under specific traffic, behavior, equipment, electricity, procurement, and waste conditions.
AxiCalculator turns those conditions into a structured comparison. Start with realistic usage. Keep scenarios consistent. Examine which variables drive the result. Use reverse solving when the project starts with a target rather than a known activity level.
The final number is not the end of the decision. It is the beginning of a better question: which realistic change reduces impact while still meeting the facility’s operational needs?
Use the AxiCalculator Hand Drying Footprint Calculator to test the current scenario, compare alternatives, and turn everyday restroom activity into data that can support a clearer sustainability decision.
Frequently Asked Questions
Can I use this calculator for a commercial building with changing daily traffic?
Should I compare paper towels and dryers using the same number of hand dries?
Why can my facility's real carbon footprint differ from the calculator result?
Can reducing paper towel use matter without changing the dispenser system?
How should an engineer perform sensitivity analysis on a hand-drying scenario?
When is a screening calculator insufficient for an engineering sustainability decision?
How can reverse solving help when a facility has a fixed carbon target?
Our engineers are here to help you get it right.