Fraction to Percent Calculator
- Last formula update:
Decimal & Rounding Policy
- Fraction-to-percent results are rounded to a maximum of 4 decimal places when needed.
- Unnecessary trailing zeros are removed, so results remain clear and easy to read.
- Percentage-to-fraction calculations use the exact entered percentage before fraction simplification; no intermediate rounding is applied.
- The displayed percentage in a percentage-to-fraction result may be rounded to 2 decimal places, while the fraction remains based on the exact input.
- Whole-number results are shown without decimal places, and large values use standard English thousands separators.
Valid range
- Numerator: Any finite positive, negative, zero, decimal, fraction, or supported mathematical expression is valid.
- Denominator: Any finite numeric value is accepted; zero produces an undefined or infinite division result and cannot produce a normal finite percentage.
- Percentage: Any finite value is valid, including zero, negative percentages, decimal percentages, and values greater than 100%.
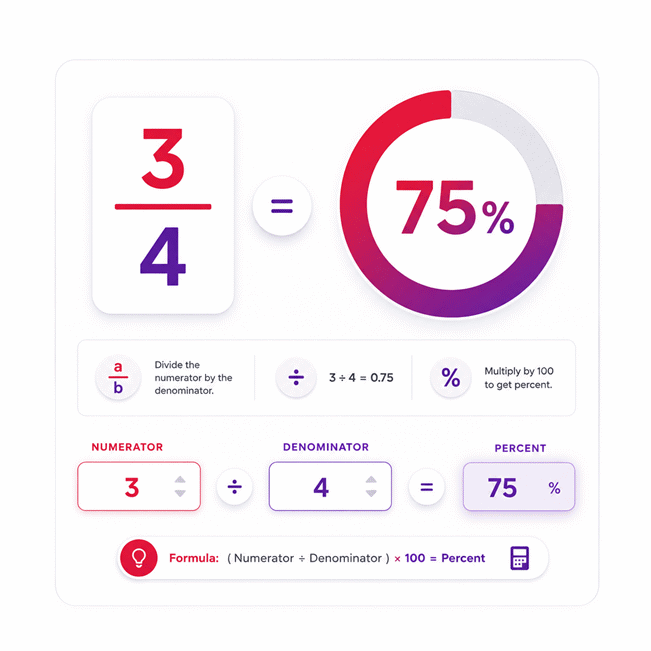
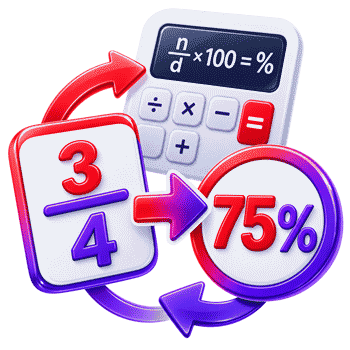
- Fraction-to-percent calculations use Percentage = (Numerator / Denominator) × 100 without restricting the fraction to values between 0 and 1.
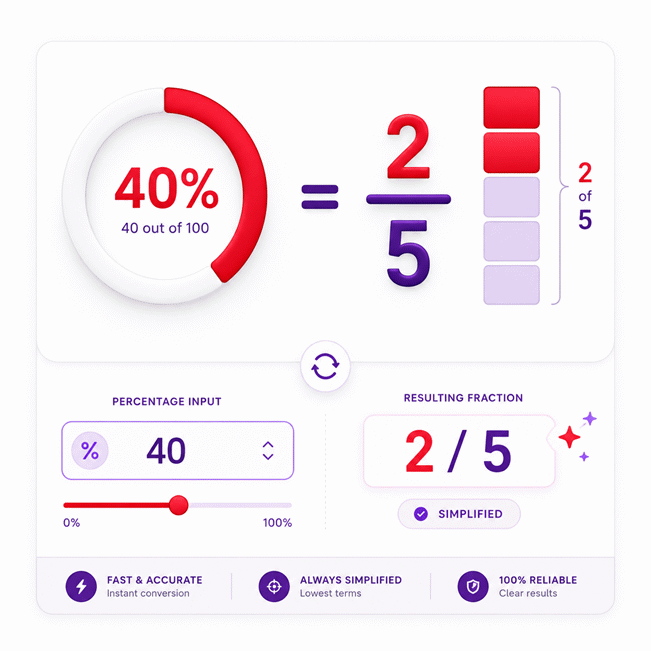
- Percentage-to-fraction calculations use Percentage / 100 and reduce the resulting fraction to its simplest exact form.

Cerelia Daxbourne
Reviewers:
Melovia Pexford
Iskren Lumthorne
Check our editorial policy
August 30, 2026
1.0.0
Initial calculator and formula release.
Our engineers are here to help you get it right.
How Does a Fraction to Percent Calculator Give an Accurate Result?
Fraction to Percent Calculator results make fraction comparisons easier by expressing a ratio on a percentage scale. Enter the numerator as the selected part and the denominator as the reference amount. The calculator evaluates their relationship and presents the equivalent percentage in real time. The same tool can also work in reverse by converting a percentage into an exact simplified fraction.
- A fraction represents a relationship between a numerator and denominator.
- Percentages express that relationship on a scale based on one hundred.
- Equivalent fractions produce the same percentage because their numerical ratios are identical.
- Fractions greater than one can correctly produce percentages above 100%.
- Negative values can produce negative or positive results depending on their signs.
- A zero numerator represents none of a valid reference amount.
- A zero denominator cannot represent a normal finite percentage relationship.
- Percentages make ratios with different totals easier to compare.
The Fraction to Percent Calculator is most useful when the relationship behind the numbers is clear. Before trusting any result, identify what the selected part and reference total represent. A quick size check can also reveal reversed inputs or an incorrect reference value. This makes the result easier to interpret in education, surveys, quality control, production tracking, analytics, and everyday comparisons.
Assumptions used in this calculator
- Inputs are assumed to represent valid numerical quantities or supported mathematical expressions.
- Fraction values are treated as dimensionless unless context assigns physical units.
- The denominator must be nonzero for a finite percentage result.
- Zero divided by zero is treated as undefined and returns no result.
- Percentage conversion uses the exact ratio before display rounding is applied.
- Decimal percentage inputs retain their exact entered precision during fraction conversion.
- Fractions are reduced using the greatest common divisor whenever simplification is possible.
- Negative values are permitted and their algebraic sign is preserved.
- Percentages may be below zero or greater than one hundred percent.
- Large results may be formatted with standard English thousands separators.
- Displayed values may be rounded without changing the underlying exact calculation.
- Results should be independently verified for regulated, safety-critical, or contractual applications.
- This calculator supports conversion, not professional engineering, financial, or legal judgment.
Results are rounded for display.
Internal calculations use full precision.
Formulas Used in Fraction to Percent Calculator :
Fraction to Percentage
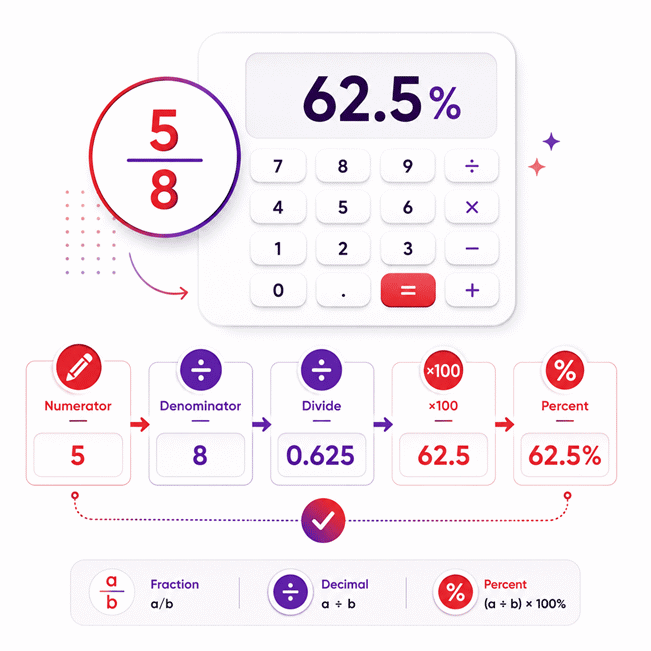
The numerator is divided by the denominator, then the result is multiplied by 100 to obtain the percentage.
Exact Percentage to Fraction
For a decimal percentage, the decimal point is removed to obtain an integer while the corresponding power of ten preserves the exact entered value.
Fraction Simplification
The numerator and denominator are divided by their greatest common divisor so the final fraction is returned in simplest exact form.
P = percentage result from the fraction-to-percentage calculation.
n = numerator of the input fraction.
d = denominator of the input fraction.
F = exact fraction produced from a percentage.
m = integer formed by removing the decimal point from the percentage value.
k = number of decimal places in the entered percentage.
g = greatest common divisor used to simplify the fraction.
Variables & Definitions
View a complete list of all variables used in this calculator, including definitions and units
Fraction to Percent Calculator Variables and Parameters
| Symbol | Variable | Role | Unit | Calculation Use |
|---|---|---|---|---|
| P | Percentage result | Output | % | Calculated from the numerator divided by the denominator and multiplied by 100. |
| n | Numerator | Input | Dimensionless | Represents the upper value of the fraction used in the fraction-to-percentage calculation. |
| d | Denominator | Input | Dimensionless | Represents the lower value of the fraction and acts as the divisor in the percentage calculation. |
| F | Exact simplified fraction | Output | Dimensionless | Represents the exact fraction obtained from the entered percentage after reduction to simplest form. |
| m | Integer percentage numerator | Intermediate | Dimensionless | Formed by removing the decimal point from the exact entered percentage value. |
| k | Decimal-place count | Intermediate | Digits | Counts the decimal places in the percentage input so its exact decimal precision is preserved. |
| g | Greatest common divisor | Intermediate | Dimensionless | Used to divide the fraction numerator and denominator and return the fraction in simplest exact form. |
Unit Conversion Table
Fraction, Decimal, and Percentage Conversion Reference
| Unit Group | Unit Name | Symbol | Equivalent in Percentage | Used For |
|---|---|---|---|---|
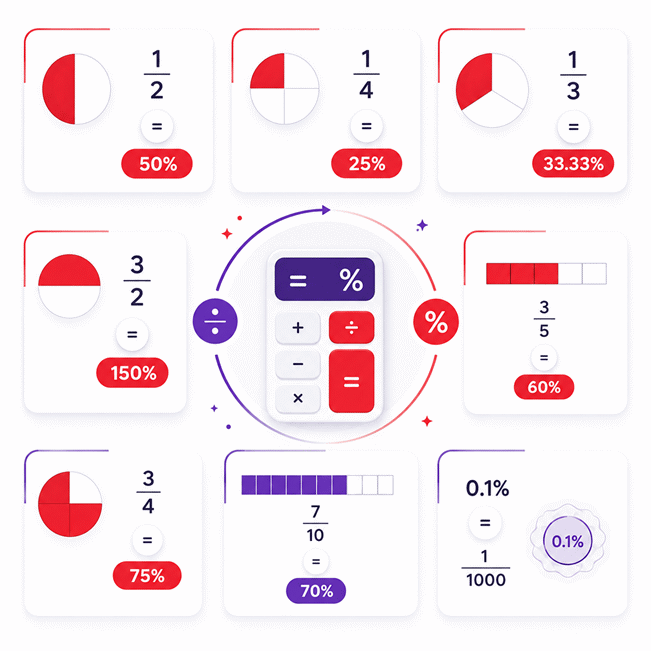
| Fraction | One Hundredth | 1/100 | 1% | Expressing one part out of one hundred. |
| Fraction | One Tenth | 1/10 | 10% | Expressing one part out of ten. |
| Fraction | One Quarter | 1/4 | 25% | Expressing one of four equal parts. |
| Fraction | One Half | 1/2 | 50% | Expressing one of two equal parts. |
| Fraction | Three Quarters | 3/4 | 75% | Expressing three of four equal parts. |
| Fraction | One Whole | 1/1 | 100% | Expressing one complete whole. |
| Fraction | Three Halves | 3/2 | 150% | Expressing one and one-half times the reference amount. |
| Decimal | One Hundredth | 0.01 | 1% | Representing one percent in decimal form. |
| Decimal | One Tenth | 0.1 | 10% | Representing ten percent in decimal form. |
| Decimal | One Quarter | 0.25 | 25% | Representing one quarter before percentage conversion. |
| Decimal | One Half | 0.5 | 50% | Representing one half before percentage conversion. |
| Decimal | Three Quarters | 0.75 | 75% | Representing three quarters in decimal form. |
| Decimal | One Whole | 1 | 100% | Representing one complete reference amount. |
| Decimal | One and One Half | 1.5 | 150% | Representing one and one-half times the reference amount. |
| Percentage | One Percent | 1% | 1% | Expressing one part per hundred. |
| Percentage | Ten Percent | 10% | 10% | Expressing one tenth on a percentage scale. |
| Percentage | Twenty-Five Percent | 25% | 25% | Expressing one quarter on a percentage scale. |
| Percentage | Fifty Percent | 50% | 50% | Expressing one half on a percentage scale. |
| Percentage | Seventy-Five Percent | 75% | 75% | Expressing three quarters on a percentage scale. |
| Percentage | One Hundred Percent | 100% | 100% | Expressing one complete reference amount. |
| Percentage | One Hundred Fifty Percent | 150% | 150% | Expressing a value greater than one whole. |
Example Calculation
The numerator 37 is divided by the denominator 48 to obtain 0.77083333...
Multiplying the decimal ratio by 100 converts the fraction into a percentage.
The unrounded percentage is 77.083333..., so no intermediate rounding is applied.
The displayed result is rounded to a maximum of four decimal places: 77.0833%.
The entered percentage is kept at its full precision of 62.375% during the calculation.
Removing three decimal places converts the percentage into the exact ratio 62,375/100,000.
Both values are divided by their greatest common divisor, 125, producing 499/800.
Only the displayed percentage may round to 62.38%; the fraction remains based on the exact input.
Results are rounded for display.
Internal calculations use full precision.
Calculations Disclaimer
How to Use a Fraction to Percent Calculator With Confidence
A result can look correct and still answer the wrong question. That risk starts before any calculation begins. First, decide what the fraction actually represents. The upper value should represent the selected part. The lower value should represent the complete reference amount. If that relationship is reversed, the final percentage answers a different question.
This matters in school, business, production, research, and daily decisions. Consider a test with 37 correct answers from 48 questions. The useful question is clear. What share of all questions was answered correctly? The completed answers form the selected part. The total question count forms the reference amount. A calculator can process the numbers instantly. It cannot decide whether those numbers describe the right relationship.
The same logic applies to production records. A plant may report 184 accepted parts from 200 inspected parts. The percentage describes accepted parts relative to inspected parts. It does not describe rejected parts. It also does not describe production growth. One fraction can support several stories. Only one story matches the chosen numerator and denominator.
READ THE RELATIONSHIP → IDENTIFY THE PART → IDENTIFY THE WHOLE → CALCULATE → CHECK THE MEANING
A useful habit is to predict the answer before using the calculator. You do not need an exact prediction. You only need a reasonable range. A fraction near one half should produce a percentage near 50%. A fraction near one whole should approach 100%. A fraction above one can produce a result above 100%. This quick check catches many input mistakes immediately.
Speed should never replace interpretation. AxiCalculator can return the result in real time. Your judgment still determines what that result means. This distinction is important for reports and decisions. A clear percentage should make the original relationship easier to understand.
When several values must be compared, percentages can simplify the picture. Suppose one class records 17 correct answers from 20 questions. Another records 43 from 50. Their raw totals differ. Percentage conversion creates a common comparison scale. The result becomes easier to scan, explain, and communicate.
Use the calculator as a decision aid, not merely a number generator. Enter the relationship. Read the result. Then ask one final question. Does this percentage describe the situation I intended to measure? That five-second check can prevent a polished but misleading answer.
When Percentage Results Look Surprising
Some correct percentages feel wrong at first glance. That reaction is useful. It signals that the relationship deserves another look. One common surprise occurs when the result exceeds 100%. Many people assume percentages must stay between zero and 100. That assumption is only true when the selected part does not exceed the reference amount.
Imagine a monthly output target of 80 units. The team completes 100 units. The achieved amount is larger than the reference target. A percentage above 100% is therefore reasonable. Nothing is broken. The result simply shows performance beyond the original baseline.
The same idea appears in finance, science, and engineering dashboards. A measured quantity can exceed a baseline. A current value can exceed a previous value. A completed amount can exceed a target. A percentage above 100% can describe all these cases clearly.
Negative values can also produce surprising results. A negative sign usually indicates direction or position. It does not automatically mean the calculation failed. For example, a negative change may describe a loss, decline, reversal, or below-zero reading. The meaning depends on the original data.
Another surprise appears when both fraction values are negative. Two negative signs can produce a positive ratio. This often looks strange to users who focus only on the symbols. The relationship itself explains the result. The two signs represent matching directions, so their ratio becomes positive.
STOP AND CHECK: A surprising percentage is not automatically an incorrect percentage.
Zero also deserves careful attention. A zero selected amount can represent none of the reference total. That situation is usually easy to interpret. A zero reference amount is very different. There is no meaningful whole against which the selected value can be compared. A calculator must treat that boundary carefully.
Large percentages should trigger a sense-check. Ask whether the selected amount truly exceeds the reference amount. Negative percentages should trigger a sign-check. Ask whether the data contains a genuine negative direction. Very small percentages should trigger a scale-check. Ask whether the selected amount is tiny compared with the total.
These checks take seconds. They also reduce silent errors. The best calculator experience combines fast computation with clear human judgment. If a result surprises you, investigate the relationship before rejecting the result.
A Fast Sanity Check Before You Trust the Number
A calculator can be fast, accurate, and still receive the wrong inputs. That is why a sanity check matters. It asks whether the answer fits the size of the original fraction. This is not a second calculation. It is a quick judgment about scale.
Start by comparing the two values. If the selected part is much smaller, expect a small percentage. If both values are similar, expect a result near 100%. If the selected part is larger, expect a result above 100%. This simple pattern catches many reversed entries.
Next, test a familiar benchmark. One half is a useful mental anchor. One quarter is another. Three quarters is also easy to recognize. Your exact fraction may differ from these values. The benchmark still helps you estimate the result quickly.
SMALL PART → SMALL PERCENTAGE | ABOUT HALF → ABOUT 50% | ABOUT EQUAL → ABOUT 100% | PART EXCEEDS WHOLE → ABOVE 100%
Now check the story behind the numbers. A survey may record 420 positive responses from 500 completed responses. That result should be high. A defect report may record 7 rejected units from 500 inspected units. That result should be low. If the displayed percentage conflicts with the story, inspect the input order.
Context also prevents a common reporting error. People sometimes compare values using different reference totals. Two percentages can only be compared meaningfully when their reference meaning is compatible. A pass rate and an attendance rate may both use percentages. They still measure different things.
ONE QUESTION CAN SAVE THE RESULT: “Percentage of what?”
This question is especially useful in dashboards. A label such as “82%” looks precise. Without a clear reference, it can still be ambiguous. Is it 82% of planned output? Is it 82% of inspected items? Is it 82% of completed tasks? The number becomes useful only when the relationship is clear.
A good workflow is short. Read the fraction. Predict the rough percentage. Calculate it. Compare the result with your prediction. Then attach the result to its real meaning. This process adds only seconds.
For routine work, this habit can become automatic. That matters when dozens of calculations appear in one report. A small input reversal can spread through charts and summaries. A fast sense-check blocks that error early.
Common Fraction to Percentage Mistakes That Cause Wrong Answers
The most dangerous mistakes often look reasonable. They produce clean numbers. They may even fit inside a report without raising suspicion. The first major mistake is reversing the relationship. If 18 items pass from 24 inspected items, the passing share compares 18 against 24. Reversing those values describes something else.
Another mistake comes from choosing the wrong reference total. Imagine 40 customers complete a survey. Thirty choose one option. Ten leave another question unanswered. The percentage for each question should use the correct response base. Using the wrong total changes the meaning.
A third mistake appears when users mix two percentage ideas. “What percentage is 30 of 50?” is different from “How much did 30 grow to 50?” These questions use different relationships. A fraction-to-percent calculator answers the first type. It should not be used to describe percentage change unless the input relationship matches that task.
Users also make mistakes when they ignore context around values above 100%. A result above 100% may be valid. It can represent performance beyond a target. It can represent a quantity larger than its baseline. Treating every large percentage as an error can create another error.
THE NUMBER MAY BE RIGHT WHILE THE QUESTION IS WRONG.
Copying data from spreadsheets can create another trap. A visible value may already represent a percentage. Entering it again as a fraction can change its meaning. Always identify the raw values before starting the conversion.
Labels matter too. A dashboard might show “success rate” beside a percentage. That label sounds clear. Yet the underlying fraction may use completed tasks, attempted tasks, or all assigned tasks. Each reference produces a different story. The label should match the actual base.
One more error comes from comparing unrelated percentages. A 90% completion rate does not automatically outperform an 80% quality rate. These percentages measure different outcomes. A percentage is useful because it normalizes a ratio. It does not erase differences between metrics.
A simple prevention method works well. Before calculating, complete this sentence: “I want the percentage of ___ out of ___.” If the sentence sounds wrong, the inputs probably need review. This method works in classrooms, audits, inspections, surveys, operations, and financial reports.
AxiCalculator reduces calculation effort. Good input logic reduces interpretation risk. Use both together. The result becomes easier to trust, explain, and reuse.
How to Check Whether a Fraction-to-Percentage Answer Is Correct
A correct-looking result should still survive a quick verification. The easiest method begins with magnitude. Compare the selected amount with the reference amount. A small fraction should not suddenly produce a huge percentage. A fraction near the whole should not produce a tiny percentage.
You can also use familiar benchmarks. If the fraction is close to one quarter, expect roughly 25%. If it is close to one half, expect roughly 50%. If it is close to three quarters, expect roughly 75%. If both values match, expect 100%.
This method is powerful because it does not depend on exact arithmetic. It checks the direction of the answer. A typo that changes 48 into 4.8 may produce a mathematically valid result. A benchmark check can reveal that something is wrong.
Another verification method uses proportional thinking. Ask whether scaling both values equally changes the relationship. It should not. Five out of ten describes the same share as fifty out of one hundred. Different numbers can represent the same ratio.
This is especially useful when reviewing data from several systems. A manufacturing dashboard may show 47 accepted units from 50. A weekly report may show 940 from 1,000. Those fractions describe the same share. Recognizing that pattern helps verify copied data.
For percentages above 100%, compare the selected amount with the reference. If the selected amount is twice as large, the percentage should reflect roughly two wholes. If it is only slightly larger, the percentage should sit slightly above 100%.
For negative results, inspect the signs. A single negative input produces a negative relationship. Two negative inputs can produce a positive relationship. This sign check is fast and often enough.
Verification becomes even more important when the result enters another decision. A percentage might feed a grade, scorecard, yield report, quality dashboard, or performance review. A small input error can become a larger reporting error downstream.
The safest habit is simple. Never verify only the displayed number. Verify the meaning behind it. Ask whether the selected amount, reference amount, and resulting percentage tell the same story.
Real-World Uses for Fraction and Percentage Conversion
Fractions often appear first. Percentages usually make them easier to compare. This is why fraction-to-percent conversion appears across education, operations, analytics, quality control, finance, and daily planning.
In education, a student may answer 42 questions correctly from 50. A percentage communicates performance more quickly than the raw fraction. It also makes comparison easier across tests with different question counts. A score of 18 from 20 and a score of 45 from 50 can be compared on the same scale.
In manufacturing, teams often track accepted parts against inspected parts. A line may inspect 800 parts and accept 776. A percentage makes the yield easier to scan. Managers can compare different shifts even when production totals differ.
In customer research, analysts may compare selected responses with completed responses. One survey may receive 250 responses. Another may receive 2,000. Raw counts alone can mislead. Percentage conversion places both results on a comparable scale.
In inventory work, teams can measure filled orders against requested orders. A warehouse might fill 480 lines from 500 requested lines. The fraction is useful internally. The percentage is easier to communicate in a service dashboard.
In project tracking, completed tasks can be compared with assigned tasks. This creates a clear progress indicator. Yet the reference total must remain stable. Adding new tasks changes the relationship. That change should be understood before comparing two dates.
Quality teams use similar thinking. Defects may be compared with inspected items. Rework cases may be compared with completed jobs. Returned units may be compared with shipped units. Each percentage answers a different operational question.
Healthcare, laboratory, and safety work may also use percentages for reporting. In those settings, interpretation matters as much as calculation. A percentage should never be detached from its defined reference group.
AxiCalculator is useful when the goal is fast comparison and clear communication. The calculator handles the arithmetic. The user controls the meaning. That separation keeps the workflow simple.
When the result matters to a report, save the original fraction beside the percentage. This small habit improves traceability. Anyone reviewing the result can see what relationship produced it. Clear inputs create clear percentages, and clear percentages support better decisions.
Frequently Asked Questions
Can I use the calculator when my fraction comes from measured or collected data?
What should I do if my fraction is not already simplified?
Can I compare percentages created from fractions with different denominators?
Why does the reverse result sometimes look less familiar than the original percentage?
How should I report a fraction-to-percent result in an engineering or laboratory document?
What can I check if my spreadsheet and the calculator show slightly different percentages?
How can I validate a percentage-to-fraction result before using it in a technical project?
Engineering Resources
Our engineers are here to help you get it right.