Doubling Time Calculator
- Last formula update:
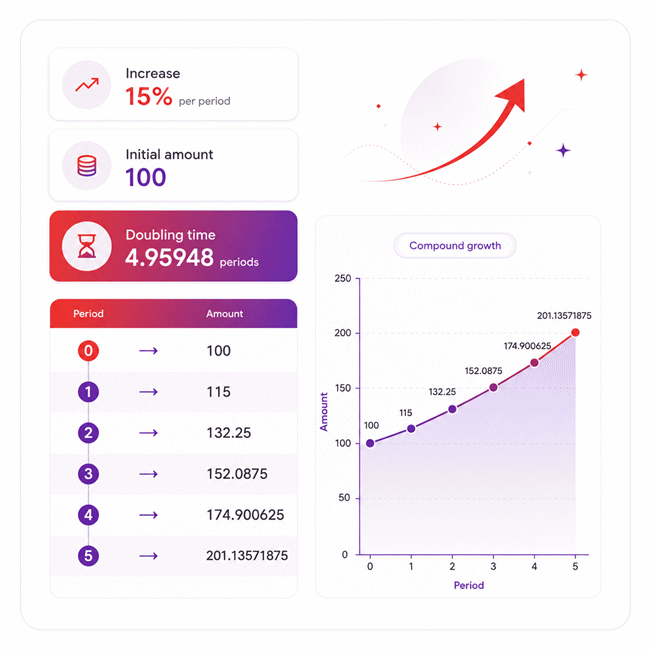
| Periods | Amount |
|---|
Decimal & Rounding Policy
- All doubling time calculations use full internal precision and are rounded only for display.
- Calculated Increase and Doubling time values are displayed with up to 5 decimal places, with unnecessary trailing zeros removed.
- Decimal input values are preserved without premature rounding before logarithmic or exponential calculations.
- The formula uses the exact percentage growth factor: 1 + (Increase / 100).
- Reverse calculations use the full-precision Doubling time before converting the result to a percentage.
- Chart values are calculated from unrounded inputs to prevent cumulative rounding errors between periods.
- Exact results such as 1 period or 300% are displayed without unnecessary decimal places.
- Large displayed numbers may use thousands separators for readability without changing their underlying numerical value.
Valid range
- Increase: Enter a finite constant growth rate of 0% or greater per period; a value above 0% is required for a finite doubling time.
- Doubling time: Enter a finite value greater than 0 periods; shorter doubling times correspond to higher constant growth rates.
- Initial amount: Enter any finite value greater than 0; it controls the visualization scale but does not change the calculated doubling time or growth rate.
- Calculation range: Inputs must be valid finite numbers, while negative growth rates, zero or negative doubling times, and non-finite values are not supported.

Cerelia Daxbourne
Reviewers:
Melovia Pexford
Iskren Lumthorne
Check our editorial policy
August 30, 2026
1.0.0
Initial calculator and formula release.
Our engineers are here to help you get it right.
How Does a Doubling Time Calculator Turn Growth Into a Clear Timeline?
Doubling Time Calculator results turn a constant percentage growth rate into an easy-to-understand time needed for a value to reach twice its starting size. The calculator also works in reverse, so a known doubling target can reveal the constant growth rate required per period.
- A higher positive growth rate produces a shorter doubling time.
- A lower positive growth rate produces a longer doubling time.
- Growth compounds on the latest amount during every period.
- The starting amount changes displayed values but not the doubling timeline.
- Reverse solving removes the need to guess a required growth rate.
- The growth chart shows how the amount moves toward and beyond the 2x level.
- Doubling can occur between whole periods, so the next plotted point may exceed 2x.
- Constant-rate growth should not be confused with fixed-value additions.
- Changing growth rates may require a more detailed growth model.
The Doubling Time Calculator is especially useful for comparing growth scenarios, testing target timelines, and understanding how repeated percentage growth develops over time. Use the known value first, review the calculated result, then change either side to explore faster or slower growth scenarios without restarting the calculation.
Assumptions used in this calculator
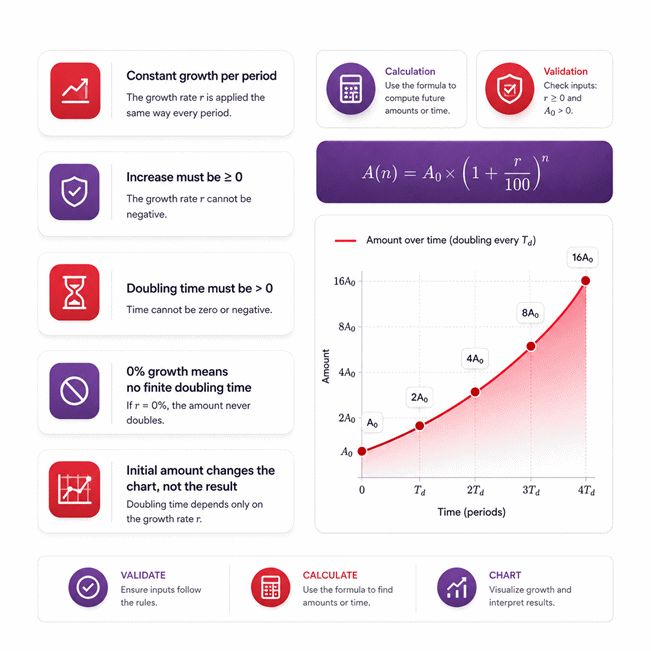
- Constant percentage growth is assumed for every compounding period.
- Growth compounds once per period using the same rate.
- The model assumes discrete compounding rather than continuous exponential growth.
- Doubling time assumes no interruptions, shocks, or rate changes.
- Initial amount affects visualization only, not the calculated doubling time.
- Input values are assumed to represent consistent units across periods.
- Negative growth rates are outside this calculator’s supported doubling model.
- Zero growth implies no finite doubling time under this model.
- Doubling time must be positive and finite for reverse calculations.
- Calculations assume the entered rate remains mathematically constant.
- Real-world capacity limits, losses, and saturation are not modeled.
- Measurement uncertainty and process variability are not automatically included.
- Results should be validated against domain-specific operating conditions before decisions.
Results are rounded for display.
Internal calculations use full precision.
Formulas Used in Doubling Time Calculator :
Doubling Time Formula
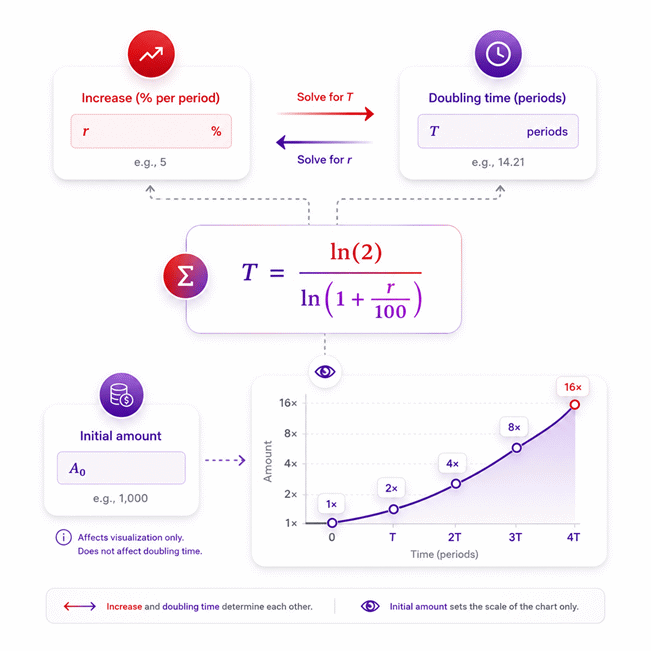
This equation calculates the number of periods required for a quantity to double when the percentage increase remains constant and compounds once per period.
Reverse Growth Rate Formula
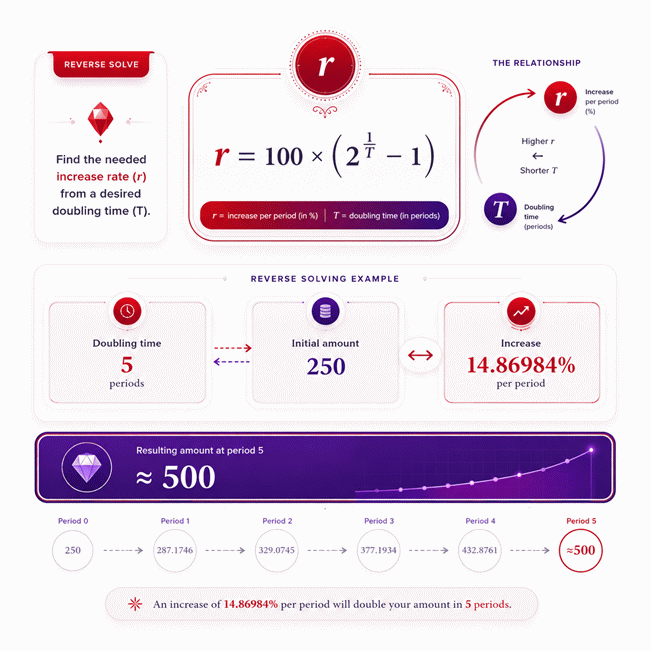
When doubling time is entered instead of the growth rate, this inverse calculation determines the constant percentage increase required in each period.
Amount by Period Formula
This compound-growth equation calculates the amount at each whole-number period for the doubling time visualization without changing the doubling-time result.
Variables
T = doubling time, measured in periods.
r = constant percentage increase per period.
A0 = initial amount at period zero.
An = calculated amount after n periods.
n = number of elapsed periods used in the visualization.
Variables & Definitions
View a complete list of all variables used in this calculator, including definitions and units
Doubling Time Calculator Variables and Definitions
| Variable | Definition | Unit | Calculation Role | Valid Range |
|---|---|---|---|---|
| T | Doubling time required for the quantity to become twice its starting value. | periods | Entered by the user or calculated from the constant percentage increase. | Finite value greater than 0. |
| r | Constant percentage increase applied during each compounding period. | % per period | Entered by the user or calculated from the doubling time. | Finite value of 0% or greater; a value above 0% is required for finite doubling. |
| A0 | Initial amount before growth begins at period zero. | amount | Sets the starting value of the visualization without changing the growth rate or doubling time. | Finite value greater than 0. |
| An | Calculated amount after a specified number of growth periods. | same as initial amount | Calculated for each plotted period using compound growth. | Positive finite result within the supported calculation range. |
| n | Number of elapsed periods used to calculate visualization points. | periods | Uses whole-number periods from zero through the final plotted period. | Integer value of 0 or greater for chart points. |
Unit Conversion Table
Growth Rate Unit Conversion Table
| Unit Group | Unit Name | Symbol | Equivalent in Decimal Rate | Used For |
|---|---|---|---|---|
| Growth Rate | Percent per period | %/period | 1%/period = 0.01/period | Primary Increase input and constant compounded growth rate. |
| Growth Rate | Decimal rate per period | 1/period | 1.00/period = 100%/period | Internal mathematical representation of percentage growth. |
| Growth Rate | Basis points per period | bp/period | 1 bp/period = 0.0001/period | Expressing small percentage growth rates with greater readability. |
Doubling Time Period Conversion Table
| Unit Group | Unit Name | Symbol | Equivalent in Calculator Periods | Used For |
|---|---|---|---|---|
| Doubling Time | Generic period | period | 1 period = 1 growth interval | Default doubling-time result when no specific time interval is assigned. |
| Doubling Time | Year-based period | yr | 1 year = 1 period when growth is %/year | Annual population, investment, production, or other constant growth. |
| Doubling Time | Month-based period | mo | 1 month = 1 period when growth is %/month | Monthly growth measurements and recurring monthly compounding. |
| Doubling Time | Week-based period | wk | 1 week = 1 period when growth is %/week | Weekly growth observations and repeated weekly processes. |
| Doubling Time | Day-based period | d | 1 day = 1 period when growth is %/day | Daily growth measurements and short-duration growth processes. |
| Doubling Time | Hour-based period | h | 1 hour = 1 period when growth is %/hour | Hourly laboratory, biological, technical, or process growth. |
| Doubling Time | Minute-based period | min | 1 minute = 1 period when growth is %/minute | Rapid growth processes measured at minute-scale intervals. |
| Doubling Time | Second-based period | s | 1 second = 1 period when growth is %/second | Very short growth intervals in controlled mathematical or technical models. |
Example Calculation
With a constant increase of 12.5% per period, an initial amount of 320 doubles to 640 after approximately 5.88495 periods. Because the visualization uses whole-number periods, the next plotted point occurs at period 6. At that point, compound growth produces approximately 648.73169. The calculation keeps full internal precision and rounds values only for display.
A doubling time of 8.75 periods requires a constant compounded increase of approximately 8.24390% per period. Starting from 425, the mathematical doubling point is 850 at exactly 8.75 periods. Because visualization points use whole-number periods, period 9 is the next plotted point and reaches approximately 867.00137. Full precision is retained during calculation and rounding is applied only to displayed results.
Results are rounded for display.
Internal calculations use full precision.
Calculations Disclaimer
What Does Doubling Time Really Tell You About Growth?
A growth rate can look simple until you ask one practical question. How long will the value need to become twice as large? That question changes an abstract percentage into a clear time target. Doubling time gives that target in periods. A period can represent years, months, days, cycles, or another repeated interval.
The key idea is easy to miss. Growth builds on the latest value, not only the starting value. Each new increase becomes part of the next growth step. This effect makes repeated percentage growth very different from simple addition. Small differences in growth rate can therefore create large timing differences.
A Doubling Time Calculator makes this relationship easier to understand. Enter a growth rate, and the corresponding doubling time appears. You can also work in the opposite direction. Enter a target doubling time, and the required growth rate becomes available.
This reverse solving feature is useful when time is your real target. A business may want to double recurring revenue within several periods. A planner may study how quickly a measured quantity could grow. An analyst may compare two growth scenarios without repeated manual calculations.
The starting amount does not control the doubling interval. This often surprises first-time users. A value of 100 and a value of 100,000 behave similarly. They share the same doubling time when their percentage growth matches.
That happens because doubling describes relative growth. The question is about reaching twice the starting amount. It is not about reaching one fixed absolute number.
Start at 1x the initial amount.
Apply the same percentage growth each period.
Each increase becomes part of the next period.
The value moves toward the 2x threshold.
Doubling time marks when that threshold is reached.
This makes doubling time useful for fast comparisons. A shorter result signals faster growth. A longer result signals slower growth. That simple interpretation can reveal differences hidden inside percentage figures.
Why Can Two Similar Growth Rates Produce Noticeably Different Timelines?
A small percentage difference can seem unimportant at first. Repeated growth changes that impression very quickly. Every period builds on all earlier growth. Therefore, each small advantage can continue expanding over time.
Imagine comparing two rates that differ by only a few percentage points. Their first periods may look almost identical. The gap can become much more visible later. Doubling time compresses that difference into one understandable metric.
This is why comparing growth rates alone can be misleading. The rate tells you how fast one period grows. Doubling time tells you what that speed means over several periods.
Why Is Doubling Time Easier to Interpret Than a Percentage Alone?
People often struggle to compare percentages without a time context. A rate may sound impressive but still need many periods. Another rate may sound only slightly higher but double much sooner.
Doubling time turns the rate into a practical waiting period. This creates a clearer mental picture. Users can compare timelines instead of comparing abstract percentages.
How Does the Doubling Time Calculator Work?
A common problem appears when users know only one side. They may know the growth rate but not the time. They may instead know the target time but not the required rate. A useful calculator must handle both situations without forcing a fixed direction.
The calculator therefore uses two-way solving. The field you change becomes the active input. The paired value then updates from that new information. You can immediately edit the calculated field again. The calculation direction then changes automatically.
This behavior removes unnecessary steps. You do not need separate calculator modes. You also do not need to copy a result into another tool. One calculation area handles both questions.
How Does the Calculator Convert Growth Rate Into Doubling Time?
Suppose you know how much a value increases each period. The calculator interprets that rate as repeated compound growth. It then determines when the growing value reaches twice its starting size.
A larger positive rate produces a shorter doubling time. A smaller positive rate produces a longer doubling time. This relationship is not linear. Cutting the rate in half does not simply double every result.
That detail matters when comparing close scenarios. Manual estimation can hide meaningful differences. Exact solving gives a cleaner answer for planning and analysis.
How Does Reverse Solving Find Growth Rate From Doubling Time?
Sometimes the target is known before the rate. You might need doubling within five periods. Another target could require ten periods. Reverse solving answers the more useful question: what constant growth rate is required?
This feature can save considerable trial and error. Without reverse solving, users may test several rates manually. Each guess creates another calculation. The process becomes slower and easier to misread.
With reverse solving, the target time becomes the input. The calculator then returns the matching periodic increase. You can change that result again and instantly reverse the calculation direction.
Know the rate? Find the time.
Know the time? Find the rate.
Change either value? The other updates automatically.
Why Does the Last Edited Field Matter?
Two editable values can create ambiguity without a clear priority rule. The calculator solves this by tracking your latest edit. Your most recent field becomes the controlling value.
This prevents endless update loops. It also makes the interaction feel natural. You can explore several scenarios without changing modes or restarting the calculation.
How Does Compound Growth Determine the Time Required to Double?
Many incorrect doubling estimates begin with one assumption. Users treat repeated percentage growth like repeated fixed additions. That approach changes the growth pattern and can distort the timing.
Compound growth behaves differently. Every period starts from the newest amount. Growth earned earlier becomes part of the next period’s base. The process creates an accelerating curve while the percentage remains constant.
This is why a percentage growth rate should not be multiplied by time. Doing that ignores the effect of earlier growth. The difference may appear small over short periods. It can become significant as more periods pass.
Why Does the Initial Amount Not Change the Doubling Time?
Users often expect a larger starting amount to take longer. That would make sense for fixed additions. Percentage growth follows a different rule.
A quantity doubles when it becomes twice its own starting size. Starting from 50 means reaching 100. Starting from 5,000 means reaching 10,000. Both targets represent the same relative change.
If the percentage growth rate is identical, both follow the same relative path. Their absolute values differ. Their doubling timeline remains the same.
The initial amount is still useful. It allows the growth visualization to show meaningful values. It changes the vertical scale and displayed amounts. It does not change the underlying doubling interval.
Why Does Growth Accelerate Even When the Percentage Stays Constant?
A constant percentage does not mean a constant numeric increase. This is one of the most important insights.
Ten percent of a small amount is small. Ten percent of a larger amount is larger. Since the base keeps growing, the absolute increase also grows.
The rate stays unchanged while the added amount becomes larger. This creates the curved pattern associated with compound growth. The result often surprises users expecting a straight line.
Same percentage rate.
Larger base after each period.
Larger absolute gain during later periods.
Faster visible growth over time.
Eventually, the value reaches twice its starting size.
What Does the 2x Threshold Actually Represent?
The 2x threshold is the point where the current value doubles. It is a relative milestone. It does not depend on one specific starting number.
This makes the metric easy to compare across different scenarios. You can compare growth speed even when starting values differ greatly.
Exact Doubling Time vs Quick Estimation: Which Approach Fits Your Decision?
A fast estimate can be useful during a conversation. A decision can demand more care. The danger begins when an estimate is treated like an exact result.
Quick mental methods offer speed. They can help with rough comparisons. However, their accuracy changes across different growth rates. A shortcut that works well in one range may drift elsewhere.
An exact Doubling Time Calculator avoids that guesswork. It follows the full compound-growth relationship. This makes it better for reports, planning, verification, and scenario testing.
Why Can a Mental Shortcut Differ From the Calculator?
A shortcut simplifies the relationship between rate and doubling time. Simplification makes mental calculation easier. It also introduces approximation error.
At some growth rates, that difference can be tiny. At others, the difference becomes easier to notice. The exact calculation remains consistent across the supported model.
This distinction matters when targets are tight. A small timing difference can affect planning. It can also change the rate required for a deadline.
Need a rough answer? A shortcut may be enough.
Need a planning number? Use the exact calculation.
Need a target growth rate? Use reverse solving.
Why Should You Compare Time Instead of Only Comparing Rates?
Two rates can look close on a spreadsheet. Their doubling times can tell another story. Translating rate into time reveals the practical impact.
This is especially useful when comparing growth plans. A slightly faster rate may save several periods. A slightly slower rate may delay the target more than expected.
Time-based comparison also improves communication. A team may understand “doubling in six periods” immediately. A percentage difference can require more explanation.
When Is Exact Solving Most Useful?
Exact solving matters when the result guides another decision. It is also useful when comparing several close scenarios. Reverse solving adds value when a deadline controls the plan.
For casual estimates, a rough method may be acceptable. For repeatable analysis, an exact calculator reduces uncertainty.
How to Read the Doubling Time Growth Chart Without Misinterpreting It
A chart can create confusion when doubling occurs between whole periods. Users may expect one plotted point to equal exactly twice the start. That expectation is not always correct.
The visualization plots growth at complete periods. The true doubling point may occur between two displayed points. When that happens, the next whole-period value can exceed twice the starting amount.
This does not mean the calculation failed. It simply reflects how the chart samples time. The mathematical doubling moment and the plotted periods serve different purposes.
Why Can the Last Visible Point Be Above Twice the Initial Amount?
Suppose doubling happens before the next complete period. The chart still needs a whole-period point. Growth continues until that point is reached.
The resulting value can therefore sit above the exact doubling level. The amount has already crossed the 2x threshold. The chart shows the next complete period afterward.
This pattern is useful rather than misleading. It helps users see how quickly growth continues after doubling. It also shows why time and plotted periods should not be confused.
What Should You Look for First in the Visualization?
Start with the first plotted amount. Then find the level representing twice that value. Follow the growth line toward that level.
Next, compare the crossing point with the nearest whole periods. This gives an intuitive view of the calculated doubling time. It also helps verify the direction of growth.
A steep curve suggests faster growth. A flatter curve suggests slower growth. The shape gives a quick visual signal before detailed reading.
First, identify the starting value.
Next, locate twice that amount.
Then, watch where the growth path crosses 2x.
Why Does Changing the Initial Amount Rescale the Chart?
The chart displays actual amounts, so the starting amount affects its scale. A larger start creates larger plotted values. A smaller start creates smaller plotted values.
The relative growth pattern remains unchanged. The doubling timeline also remains unchanged. Only the displayed amount scale moves.
Where Can Doubling Time Support Better Real-World Decisions?
A percentage can feel meaningless when a decision needs a timeline. Doubling time gives that rate a more practical interpretation. It can help users compare growth scenarios across many fields.
Business teams can use it to translate recurring growth into time. Analysts can compare growth speeds across different datasets. Planning teams can test the rate needed for a target period.
Population studies may also use doubling time as a descriptive growth measure. The same idea can support economic or production scenarios. The model remains useful when growth follows a stable percentage pattern.
How Can Business Teams Use Doubling Time Without Overcomplicating Planning?
Revenue growth often appears as a percentage in reports. That number does not immediately show how long 2x growth might take.
Doubling time converts that rate into a simple timeline. Teams can compare several plans using the same measure. Reverse solving can also show the rate required by a target date.
This does not replace a full forecast. Real businesses face changing demand, costs, capacity, and competition. The metric is best used as one clean growth lens.
How Can Analysts Compare Different Growth Scenarios More Clearly?
Raw percentages can hide practical differences. Doubling time puts those rates on the same time scale.
An analyst can compare faster and slower scenarios more easily. The difference becomes a timeline rather than a percentage gap. This often makes reports easier for nontechnical readers.
Reverse solving also supports target-based planning. Instead of asking how long a rate needs, start with time. The tool then shows the matching growth requirement.
Why Is Reverse Solving Valuable for Target-Driven Planning?
A deadline changes the question completely. You no longer ask what one rate will do. You ask what rate the deadline demands.
Reverse solving provides that answer without repeated guessing. This helps create cleaner scenario planning. It also reduces mistakes from manual trial and error.
A good growth target should remain understandable after the calculation ends.
Translate every percentage into time, then compare the practical impact.
What Are the Most Common Doubling Time Calculation Mistakes?
A calculator can return a clean number while the interpretation remains wrong. Most problems begin before the calculation itself. The biggest risks come from mixing growth models or misreading the period.
One common mistake treats compound growth as simple addition. Another mistake assumes every historical rate stayed constant. Some users also compare rates measured over different intervals.
These errors can produce believable results. That makes them more dangerous. A result should always match the meaning of its input.
Mistake One: Treating Percentage Growth Like a Fixed Addition
A percentage increase depends on the current amount. A fixed addition does not. Mixing these ideas changes the growth path.
Repeated percentage growth compounds over time. Each period begins from a new base. A simple additive approach ignores that effect.
The resulting doubling estimate can therefore drift from the actual compound-growth timeline. The gap becomes more important across many periods.
Mistake Two: Using a Changing Rate as Though It Never Changes
Real growth often moves up and down. One period may grow quickly. The next period may grow slowly.
A single doubling time is easier to interpret when one representative rate is appropriate. Highly unstable growth needs deeper analysis. Otherwise, one number can hide important variation.
Users should therefore understand what their chosen growth rate represents. It may describe a target, an average trend, or a planning scenario.
Mistake Three: Mixing Different Time Periods
A monthly rate and an annual rate describe different growth intervals. Comparing them directly can create a false conclusion.
The period attached to the rate gives meaning to the result. A rate per month creates a monthly doubling timeline. A rate per year creates a yearly timeline.
Keeping the time basis clear makes comparisons more reliable. It also prevents large interpretation errors.
Mistake Four: Assuming the Starting Amount Controls the Doubling Speed
This mistake feels intuitive because larger numbers look harder to double. Percentage growth does not work that way.
The same constant percentage produces the same relative path. A larger amount gains more absolute value each period. That allows it to maintain the same doubling timeline.
The starting value matters for displayed amounts. It does not determine the relative growth speed.
How Can You Catch a Suspicious Result Before Using It?
Start by checking whether the result moves in the expected direction. Faster growth should produce shorter doubling time. Slower growth should produce longer doubling time.
Next, review the meaning of the period. Make sure the growth interval matches your interpretation. Finally, compare the result with the growth visualization.
These simple checks catch many input and interpretation mistakes. They also make the result easier to explain to others.
A trustworthy calculation should make sense before it looks impressive.
If the direction feels wrong, inspect the growth model and time basis.
How Can You Use AxiCalculator for Faster Growth Analysis?
Manual calculations become frustrating when you need several scenarios. Changing one rate may require repeating every step. Reverse calculations create even more work.
AxiCalculator reduces that friction by keeping both directions editable. You can test a growth rate and see its doubling time. You can then edit the time and discover the required rate.
The visualization adds another layer of clarity. It shows how the amount changes across periods. This helps connect an abstract rate with a visible growth path.
The best workflow is simple. Start with the value you already know. Let the calculator solve the missing side. Then change the result to explore another target.
Use Growth Rate First When You Know Current Performance
Start with the periodic growth rate when performance is already known. The calculator converts that rate into a doubling timeline.
This approach works well for comparing current growth scenarios. It also shows how sensitive the timeline is to rate changes.
Try nearby rates after the first result. Small adjustments can reveal surprisingly large timing differences. This is often where useful planning insight appears.
Use Doubling Time First When You Have a Target Deadline
Start with doubling time when the deadline matters most. Reverse solving then reveals the growth rate required by that target.
This approach is useful for goal-driven planning. It turns a vague ambition into a measurable growth requirement.
You can then adjust the target period and watch the required rate change. A slightly longer timeline may reduce the required rate significantly.
What Should You Do After Getting the Result?
Do not stop at the first number. Change one input and test another scenario. Compare the difference in time or required growth.
Then review the visualization. Make sure the growth path matches your expectations. Share the result when another person needs the same scenario.
A useful calculator should shorten the path from question to understanding. That is the goal of the AxiCalculator Doubling Time Calculator.
Frequently Asked Questions
What does a result like 6.4 periods mean in practical terms?
Can I compare doubling times from two systems with different starting values?
What kind of growth-rate data should I enter for a reliable result?
How should I use doubling time when future growth is uncertain?
How can I determine whether my measured data actually follows the calculator's growth model?
How can an engineer test whether a target doubling time is operationally realistic?
What should I document when using a doubling-time result in a technical report or university project?
Our engineers are here to help you get it right.