Average Percentage Calculator
- Last formula update:
Decimal & Rounding Policy
- Enter percentages as real numbers, including integers, decimals, negative values, and values above 100.
- The Average Percentage Calculator keeps full numerical precision during all intermediate calculations to minimize rounding error.
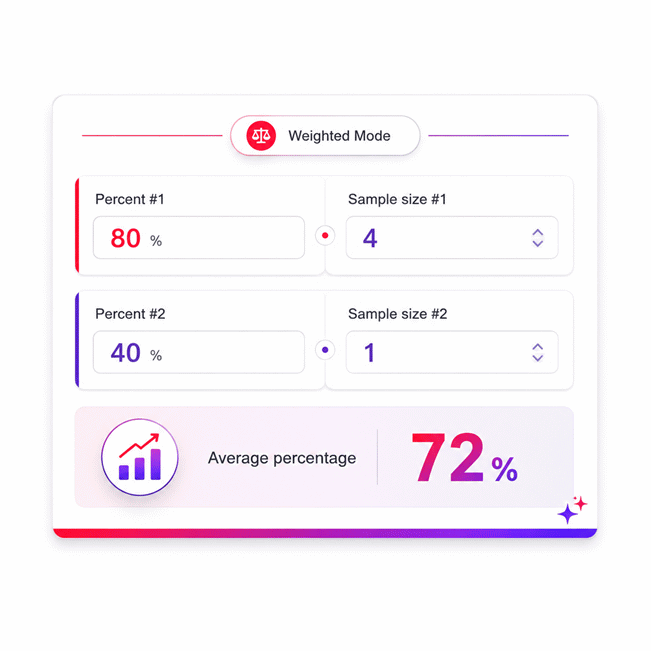
- For equal sample sizes, the result is calculated using the arithmetic mean; different sample sizes use the weighted average formula.
- Rounding is applied only to the final displayed average percentage, never to intermediate values.
- Results use only the decimal places needed for a clear and accurate value, with unnecessary trailing zeros removed.
- Exact whole-number results are displayed without extra decimal zeros, while repeating decimal results are shown with practical precision.
Valid range
- Percent values may be any finite real number, including negative values, decimals, zero, and values above 100.
- Sample size values must be finite real numbers greater than 0; zero, negative, empty, and non-numeric values are invalid.
- The calculator supports between 2 and 10 active percentage entries or weighted groups.
- All active Percent fields must contain valid numbers before an average percentage is calculated.
- In weighted mode, every active Percent value must also have a valid corresponding Sample size.
- Average percentage is a calculated read-only result and has no independent input range.

Cerelia Daxbourne
Reviewers:
Melovia Pexford
Iskren Lumthorne
Check our editorial policy
August 30, 2026
1.0.0
Initial calculator and formula release.
Our engineers are here to help you get it right.
How Does the Average Percentage Calculator Give the Correct Overall Percentage?
Average Percentage Calculator helps you combine multiple percentage values while choosing the method that matches your data. The key decision is simple: use an arithmetic average when every percentage has equal influence, and use a weighted average when the percentages represent groups with different sample sizes. The Average Percentage Calculator supports this distinction directly, helping prevent results that look reasonable but do not represent the underlying data correctly.
- Use the simple average when percentages represent equal-sized or equally weighted groups.
- Use sample-size weighting when the groups contain different amounts of data.
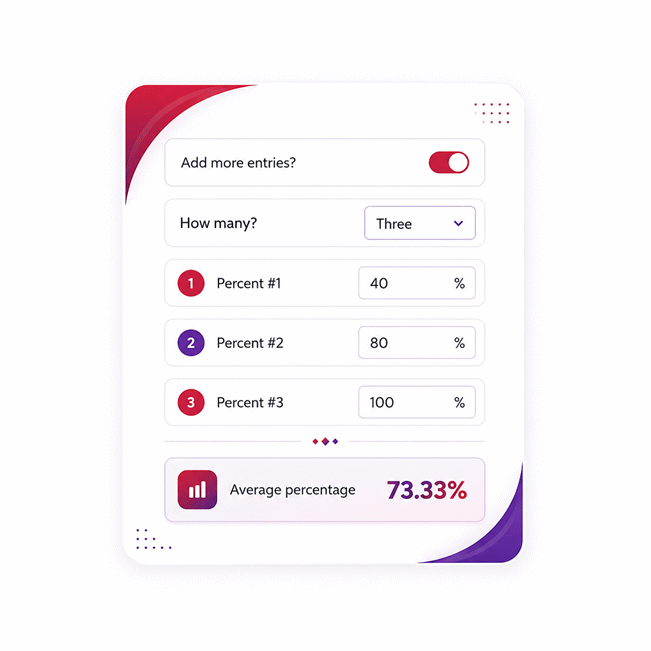
- Enter between 2 and 10 active percentage values for one combined result.
- Percentage inputs may include decimals, negative values, zero, or values above 100.
- Sample sizes must be valid positive numbers greater than zero.
- Every required active input must be complete before a result appears.
- Calculations update automatically as valid input values change.
- Hidden entries do not affect the result unless they become active again.
- Always check the group behind each percentage before choosing an averaging method.
This approach is useful for surveys, test results, conversion rates, business KPIs, production batches, quality control, and other grouped percentage data. The most important rule is to match the calculation method to what each percentage actually represents.
Assumptions used in this calculator
- All percentage inputs are assumed to represent comparable measures or outcomes.
- Percentages may be negative, zero, decimal, or greater than one hundred.
- Equal sample sizes are assumed when weighted mode is not enabled.
- Weighted calculations assume each sample size correctly corresponds to its percentage.
- Every active sample size must be finite and greater than zero.
- All active entries are assumed valid before a result is calculated.
- Sample sizes are treated as relative weights in weighted averaging.
- No percentage value is automatically capped to a conventional range.
- Intermediate calculations retain full precision until the final displayed result.
- Displayed rounding does not alter the underlying mathematical calculation.
- Inputs are assumed independent unless the user’s data methodology states otherwise.
- The calculator does not assess sampling bias, uncertainty, or statistical significance.
- Users remain responsible for validating source data before professional or industrial use.
Results are rounded for display.
Internal calculations use full precision.
Formulas Used in Average Percentage Calculator :
- A = calculated average percentage.
- pi = percentage value for entry i.
- si = positive sample size associated with percentage entry i.
- n = number of active entries, from 2 through 10.
- i = index identifying each active entry.
Arithmetic Average for Equal Sample Sizes
This formula is used when all active percentage entries have equal importance or represent equal sample sizes.
Weighted Average for Different Sample Sizes
This formula is used when active percentages represent different sample sizes; every sample size must be greater than zero.
Variables & Definitions
View a complete list of all variables used in this calculator, including definitions and units
Average Percentage Calculator Variables and Parameter Definitions
| Variable | Name | Unit | Valid Range | Role in Calculation |
|---|---|---|---|---|
| A | Average percentage | % | Any finite calculated real value | Final result calculated as an arithmetic or weighted average. |
| pi | Percentage value | % | Any finite real number | Represents the percentage assigned to active entry i. |
| si | Sample size | Dimensionless count or consistent sample quantity | Finite real number greater than 0 | Acts as the weight for percentage pi when sample sizes differ. |
| n | Number of active entries | Entry count | 2 to 10 | Determines how many percentage entries participate in the calculation. |
| i | Entry index | Index | 1 to n | Identifies each corresponding percentage and sample-size pair. |
Unit Conversion Table
Percentage Representation Conversion Table
| Unit Group | Unit Name | Symbol | Equivalent in Percent | Used For |
|---|---|---|---|---|
| Percentage | Percent | % | 1% = 1% | Direct calculator percentage inputs and average percentage output. |
| Decimal Representation | Decimal | 1 | 0.01 = 1% | Representing percentages as proportions between calculations. |
| Fraction Representation | Fraction of One | - | 1/100 = 1% | Expressing a percentage as an exact fractional proportion. |
Sample Size and Weight Equivalence Table
| Unit Group | Unit Name | Symbol | Equivalent in Relative Weight | Used For |
|---|---|---|---|---|
| Sample Size | Observation | observation | 1 observation = weight 1 | Datasets where each observation contributes equally to sample size. |
| Sample Size | Person | person | 1 person = weight 1 | Surveys, population studies, polls, and grouped participant results. |
| Sample Size | Item | item | 1 item = weight 1 | Quality control, production batches, inventory, and inspected products. |
| Sample Size | Trial | trial | 1 trial = weight 1 | Experimental, laboratory, reliability, and repeated-test datasets. |
| Sample Size | Record | record | 1 record = weight 1 | Database, analytics, reporting, and grouped digital datasets. |
| Relative Weight | Sample Weight | si | si samples = weight si | Weighting each percentage according to its corresponding sample size. |
Example Calculation
Production batch 1: 92.5% quality acceptance from 240 inspected items.
Production batch 2: 87.3% quality acceptance from 360 inspected items.
Production batch 3: 96.8% quality acceptance from 150 inspected items.
The three percentages represent groups with different sample sizes, so a simple arithmetic mean would not accurately represent the combined data.
Each percentage is multiplied by its corresponding sample size before the weighted values are added together.
The weighted total is divided by the combined sample size of 750 items.
The resulting overall quality acceptance percentage is 90.864%.
General arithmetic average formula:
General weighted average formula:
Reverse solving is intentionally not included in this Average Percentage Calculator because the average percentage is a calculated, read-only output.
If any required percentage or sample-size input is missing or invalid, the result remains empty rather than solving for the missing value.
The calculator only evaluates the arithmetic average for equal sample sizes or the weighted average when different sample sizes are provided.
Therefore, no reverse-solving example or rearranged unknown-input formula is used in the calculator's locked calculation method.
Results are rounded for display.
Internal calculations use full precision.
Calculations Disclaimer
How to Calculate Average Percentage Correctly
A percentage result can look simple while hiding an important detail. The Average Percentage Calculator helps you avoid that trap. The Average Percentage Calculator also separates two different data situations automatically. That distinction matters whenever percentages describe groups rather than isolated numbers.
The first question is not about arithmetic. Ask what each percentage represents. Two percentages may describe groups of equal size. They may also describe groups with very different sizes. Those situations should not be treated in the same way.
Suppose several departments report completion rates. Each department may have the same number of tasks. In that case, every percentage has equal influence. Now imagine one department handles ten times more tasks. Its percentage represents much more activity. Giving both departments equal influence can hide the real overall picture.
This is why context comes before calculation. A percentage carries information about a rate. It may also carry information about a group behind that rate. Losing the second part can change the meaning of the final result.
Quick check: ask whether every percentage represents the same amount of data. If yes, use equal influence. If not, include the group sizes.
AxiCalculator keeps this decision visible. You can start with ordinary percentage entries. You can then enable different sample sizes when needed. This prevents a common mistake before it reaches the final result.
The tool also works in real time. There is no separate calculation step. Once the required information is complete, the result appears immediately. This makes comparison faster during study, reporting, analysis, or operational work.
Arithmetic Average for Equal Sample Sizes
A simple average works well when every percentage has the same importance. This is common when the underlying groups are equal. It also works when the percentages are independent values by design.
Think of the decision in plain language. Each percentage receives one equal vote. No percentage receives extra influence. This creates a balanced result when the underlying data supports equal treatment.
The method is useful for repeated ratings, equal-sized teams, matched reporting periods, and similar datasets. The key word is equal. Equal influence should reflect the structure of the data, not convenience.
A frequent mistake is choosing the simple method because it looks easier. Ease should never decide the method. The data structure should decide it.
Weighted Average for Different Sample Sizes
Unequal groups create a different problem. A percentage from a large group should usually influence the result more. A percentage from a small group should usually influence it less.
This matters in survey data, production reports, pass rates, and campaign performance. It also matters when departments handle different workloads. The percentages may look comparable, yet their underlying scale differs.
Weighted averaging preserves that scale. Each percentage stays connected to the amount of data it represents. The result therefore reflects the combined population more faithfully.
Do not choose weighting merely because it sounds more advanced. Use it when group size carries real meaning. Correct weighting is about representation, not complexity.
Simple Average vs Weighted Average Percentage: Which Method Should You Use?
The hardest part often happens before any calculation begins. Users see percentages and assume they can average them directly. Sometimes they can. Sometimes that produces a poor summary.
The fastest decision test uses one question: do the percentages represent equal-sized groups? If the answer is yes, a simple average is usually suitable. If the answer is no, group size deserves attention.
This decision becomes important when percentages describe rates. A rate tells you what happened inside a group. It does not tell you how large that group was. Two identical-looking percentages can represent very different amounts of activity.
That hidden difference explains many confusing results. The arithmetic may be correct while the interpretation is poor. Good analysis requires both correct arithmetic and correct context.
When a Simple Average Gives the Correct Result
A simple average is appropriate when each entry deserves equal influence. Equal group sizes are the clearest case. Another case occurs when the values are intentionally treated as equal observations.
For instance, monthly performance percentages may be equally weighted by policy. In that situation, each month contributes one equal period. The method matches the reporting goal.
However, a different goal may require another method. If monthly transaction volumes vary widely, equal weighting may no longer answer the intended question. You must decide what the final percentage should represent.
This distinction protects users from false confidence. A calculator can process numbers perfectly. It cannot decide what your dataset means without the correct inputs.
Why Unequal Sample Sizes Can Distort a Simple Average
Imagine two groups with sharply different sizes. One contains a small number of observations. The other contains hundreds. Treating their percentages equally gives both groups the same influence.
That may exaggerate the smaller group. It may also weaken the impact of the larger group. The final number can then look balanced while describing the combined data poorly.
Eye check: a percentage never reveals its denominator by itself. Always ask how much data sits behind the rate.
This issue appears in many practical settings. A small customer campaign should not automatically equal a large campaign. A small class should not automatically equal a large class. A short production batch should not automatically equal a large batch.
One Denominator Question Prevents Most Mistakes
Ask one question before trusting the result: what does each percentage represent? This simple habit catches many errors.
If every percentage comes from the same-sized base, comparison is straightforward. If the bases differ, the result may need weighting. The decision becomes easier once the denominator is visible.
This habit also improves communication. A manager can explain why one group influenced the result more. A student can justify the selected method. An analyst can document the calculation path clearly.
How to Average Multiple Percentages From 2 to 10 Entries
Real datasets rarely stop at two values. You may need several departments, batches, classes, periods, or survey groups. AxiCalculator supports this workflow without forcing a crowded interface at the start.
Begin with the visible entries. Add more only when your dataset needs them. The active entry count controls which percentage fields participate. This keeps the working area focused.
The same structure also applies when group sizes matter. Each active percentage can be paired with its related sample size. The visual pairing reduces the risk of mixing one group’s rate with another group’s size.
That pairing becomes more valuable as the dataset grows. Ten percentages can become difficult to track manually. Clear row relationships make review easier before the final result appears.
Adding, Removing, and Preserving Percentage Entries
Changing the number of active entries should not destroy useful work. A good calculator must support exploration. Users often test several reporting structures before choosing one.
When you increase the entry count, earlier values remain available. New fields can then be completed. The result waits until the active dataset is ready.
When you reduce the count, only the active entries matter. Previously entered values can remain available for later use. This lets you compare smaller and larger datasets without repeated typing.
Fast workflow: enter data once, change the active group count, and compare scenarios without rebuilding the dataset.
What Happens When an Active Percentage Entry Is Missing?
An incomplete dataset should not quietly produce a complete-looking answer. That would create false confidence.
If an active entry is missing, the current dataset is not ready. The calculator therefore waits for the required information. This behavior protects the meaning of the result.
The same principle helps during data entry. You can move through several fields without worrying about a premature answer. Once the active set is complete, calculation resumes automatically.
Common Mistakes When Averaging Percentages
Most errors do not come from difficult mathematics. They come from choosing the wrong interpretation. That is good news because interpretation can be checked quickly.
The first mistake is averaging percentages while ignoring group sizes. The second is mixing percentages that describe different metrics. The third is comparing periods that do not represent similar conditions.
Another mistake is assuming every rate should contribute equally. Equal influence must be justified by the data. It should not be the default simply because the percentages appear together.
Users also confuse an average of percentages with a percentage calculated from combined totals. Those results can match in some datasets. They can differ greatly in others.
Averaging Percentages With Different Denominators
Different denominators are a warning sign. They tell you that each percentage may represent a different amount of data.
Consider business reporting. Two branches may publish success percentages. One branch may process far more cases. Equal treatment can make the smaller branch look more influential than it really is.
The same issue affects education, manufacturing, testing, and analytics. Whenever the underlying counts differ, inspect them before combining the rates.
The important idea is simple: percentages summarize groups. Good averaging respects the groups behind them.
Treating Missing Data as Real Data
A blank entry does not mean zero performance. It means no value has been supplied. Confusing these states can damage a report.
The safest workflow keeps missing information separate from actual numerical results. Enter only known data. Complete the active set before interpreting the output.
This distinction is especially important in operational dashboards. A missing department report should not become a zero score automatically. That would change the business meaning of the data.
Real-World Uses of Average Percentage Calculations
Percentage averaging appears anywhere groups report rates. The method looks small, but its impact can be large. A poor summary can influence staffing, quality decisions, budgets, and performance reviews.
The best use starts with a clear question. Are you comparing independent rates? Are you combining them into one overall rate? Do the groups have similar sizes? These questions define the correct approach.
AxiCalculator is useful when you need a quick answer without hiding that decision. You can begin with equal treatment. You can then switch to sample-size weighting when the dataset requires it.
Surveys, Test Scores, and Group Results
Survey percentages often come from groups with different respondent counts. That makes group size important. A small segment should not automatically influence the result like a large segment.
Education creates the same issue. Classes may report pass percentages. Yet class sizes can vary. Combining those rates without considering enrollment can misrepresent the overall student result.
Group-based reporting becomes clearer when rates and group sizes stay connected. The final percentage then answers a defined question instead of producing a convenient number.
Marketing, Conversion Rates, and Business KPIs
Marketing teams often compare conversion rates across campaigns. Traffic volumes can differ dramatically. A small campaign with a high rate may look impressive but represent few conversions.
A larger campaign may show a lower rate while generating more total outcomes. Combining both rates requires attention to their underlying traffic.
The same principle applies to support resolution rates, sales close rates, and service completion rates. Always identify the activity volume behind each percentage.
Eye check: the highest percentage is not always the most influential percentage.
Production Quality and Batch Performance
Industrial teams often track acceptance, rejection, yield, and defect percentages. Batch sizes may change between shifts, machines, plants, or production runs.
A small batch can show excellent performance. A larger batch may show slightly lower performance. Giving both batches equal influence may distort the combined operational picture.
Sample-aware averaging helps quality teams interpret grouped rates more fairly. It also makes internal reporting easier to defend. Each percentage remains connected to the production volume behind it.
Why Batch Size Matters in Industrial Reporting
Batch size changes influence. A rate based on thousands of inspected items represents more observations. A rate based on a small inspection group represents fewer.
This does not make the smaller group unimportant. It means the combined result should reflect the scale of each group.
Engineers and managers should still inspect individual groups. An overall percentage can hide a local problem. Use the combined result for summary, not for replacing detailed investigation.
A Faster Decision Workflow for Percentage Data
Good percentage analysis does not need a long process. A short sequence can prevent most interpretation errors.
- Identify what every percentage measures.
- Confirm that all percentages describe the same metric.
- Check the amount of data behind each rate.
- Decide whether entries deserve equal influence.
- Use sample-size influence when the groups differ.
- Review the final result against the original question.
This workflow separates calculation from interpretation. Both matter. A mathematically correct result can still answer the wrong business question.
Before You Calculate
Start by checking meaning, not numbers. A percentage for customer satisfaction should not mix with a completion rate. Similar-looking values can measure different outcomes.
Next, inspect the groups. Look for unequal populations, workloads, transactions, respondents, or inspected items. This reveals whether equal influence makes sense.
Finally, decide what the result should describe. A typical group and a combined population are different questions. Your method should match the question.
How to Read the Result
The final percentage is a summary. It compresses several inputs into one number. That convenience can also hide detail.
Use the result as a high-level indicator. Then inspect individual percentages when decisions carry operational impact. A strong average can hide one weak group. A weak average can hide one exceptional group.
The best reporting keeps both levels available. Show the overall percentage for speed. Keep the component rates for diagnosis.
When the Result Deserves a Second Look
Pause when one group is much larger than the others. Pause when rates vary sharply. Pause when the combined result feels inconsistent with the raw data.
These signals do not mean the calculator failed. They mean the dataset deserves interpretation. The output should support judgment, not replace it.
Also review any result used for major operational decisions. Confirm that the selected percentages describe comparable outcomes. Check that every group belongs in the same analysis.
Why AxiCalculator Fits Fast Percentage Analysis
Users usually arrive with one goal: get a dependable result without unnecessary steps. AxiCalculator keeps the workflow focused on that goal.
The calculator starts with a clean set of percentage fields. More entries appear only when needed. Different group sizes can be enabled without rebuilding the percentage data.
This design helps students, analysts, managers, marketers, and technical teams. Each user can work from the same core idea. Equal groups receive equal influence. Different groups can reflect their actual size.
The value is not extra complexity. The value is knowing when complexity matters.
Real-Time Calculation Reduces Friction
Waiting for a separate Calculate button adds an unnecessary step. Real-time updates make exploration faster. You can change one value and see the effect immediately.
This is useful when checking reports or comparing scenarios. It also helps during learning. The connection between input changes and output changes becomes easier to see.
Fast interaction should not remove control. The calculator waits when required active data is incomplete. That balance keeps the experience responsive without creating misleading results.
Technical Interpretation and Decision Guidance Stay Separate
The calculation answers a mathematical question. Your decision may involve a broader business question. These tasks should remain separate.
For technical interpretation, focus on group structure and influence. For decisions, consider the operational context behind those groups. A percentage cannot explain every cause behind performance.
This separation prevents overconfidence. The result can summarize the data well. Human judgment still decides what action follows.
Final check: do not ask only, “What is the average?” Ask, “What should this average represent?”
Turn Percentage Data Into a Result You Can Actually Use
A useful average should simplify information without changing its meaning. That is the real goal. The calculation itself is only one part of the process.
Start with the percentages you need to combine. Check whether their groups are comparable. Then decide whether those groups deserve equal influence.
If they do, keep the calculation simple. If they do not, keep each percentage connected to its group size. That one decision prevents many misleading summaries.
AxiCalculator gives you both workflows in one place. You can move between them without rebuilding your data. The result updates as the active information changes.
Use the final percentage as a clear summary. Keep the original group results nearby when deeper review matters. This gives you speed without losing context.
For quick analysis, reporting, education, marketing, surveys, and industrial performance checks, that balance is valuable. You get one result while still respecting the data behind it.
Frequently Asked Questions
Can I use this calculator when my percentages come from different types of datasets?
Why can two sets of percentage data produce the same average but tell different stories?
Should I remove unusually high or low percentages before calculating the average?
Can I use the average percentage as the only number in a report or presentation?
How should an engineer combine acceptance percentages from production lots with very different inspection counts?
What should I do when I know percentage results but the original sample sizes are unavailable?
How can a student or analyst verify that a weighted percentage result is not being distorted by one dominant group?
Our engineers are here to help you get it right.