Annealing Temperature Calculator
- Last formula update:

Decimal & Rounding Policy
- All annealing temperature calculations use full internal precision before the final result is displayed.
- User-entered primer and target melting temperatures are not rounded before applying the calculation formula.
- Calculated temperatures are displayed to a practical precision of up to 2 decimal places, such as 66.77 °C.
- Unit conversions are performed from the unrounded temperature value, then rounded only for display.
- Reverse calculations follow the same precision rules to minimize cumulative rounding errors.
- Trailing decimal zeros may be omitted when they do not change the temperature value.
Valid range
- Primer melting temperature: Use a finite experimentally determined melting temperature for the less stable primer; the calculation is performed on the Celsius temperature scale.
- Target melting temperature: Use a finite experimentally determined melting temperature for the target DNA; the calculation is performed on the Celsius temperature scale.
- Annealing temperature: Typical PCR annealing temperatures are approximately 50 to 65 °C, while the calculated optimum may occasionally fall slightly outside this practical range.
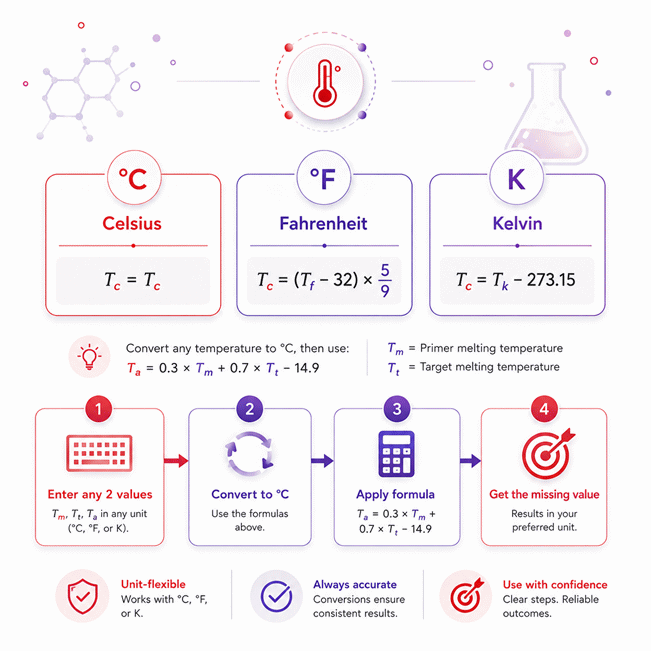
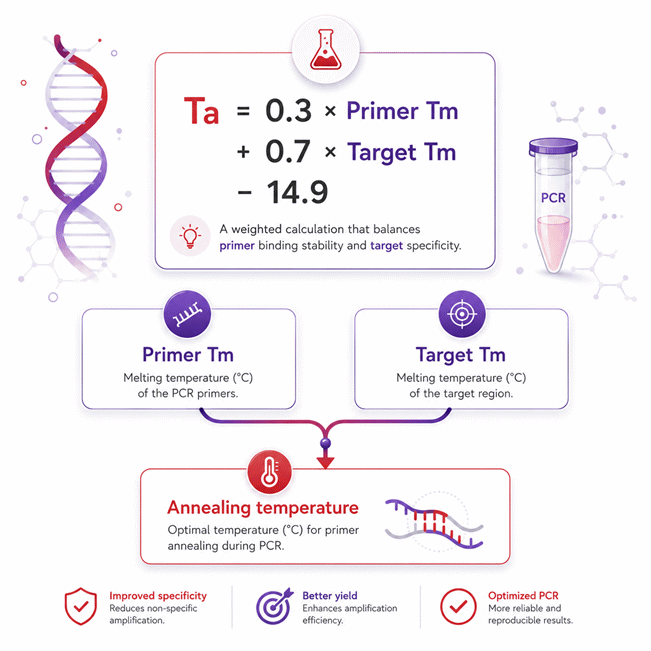
- Calculation rule: Ta = 0.3 × Primer Tm + 0.7 × Target Tm − 14.9 when all temperatures are expressed in °C.
- Values entered in °F or K should be converted to °C before applying the locked calculation formula.

Olivara Dremmont
Reviewers:
Urellyn Vexmere
Ralven Pexthorne
Check our editorial policy
August 30, 2026
1.0.0
Initial calculator and formula release.
Our engineers are here to help you get it right.
How Does the Annealing Temperature Calculator Help Optimize PCR?
Annealing Temperature Calculator results help you select a practical starting temperature for PCR before experimental optimization. The calculation links the melting temperature of the less-stable primer with the melting temperature of the expected PCR product, giving a consistent estimate of the annealing temperature needed for reaction planning.
- The calculator connects primer stability, product melting behavior, and PCR annealing temperature.
- Primer Tm, product Tm, and annealing Ta represent different temperature concepts.
- Reverse solving can recover a missing primer or product Tm from two known values.
- A higher annealing temperature can improve specificity but may reduce amplification yield.
- A lower annealing temperature can improve binding but may increase nonspecific amplification.
- Gradient PCR helps identify the best practical temperature around the calculated starting point.
- Polymerase chemistry, buffer composition, magnesium, additives, and primer design can affect performance.
- GC-rich templates and mismatched primer pairs may require additional experimental optimization.
- A correct temperature cannot compensate for poor primers, damaged template, or incorrect reaction setup.
The Annealing Temperature Calculator is most useful as part of a structured PCR workflow: calculate the starting Ta, test the reaction, inspect specificity and yield, refine the condition, and document the final working temperature.
Assumptions used in this calculator
- Formula assumes temperatures are normalized to Celsius before calculation.
- Primer melting temperature represents the less stable primer in the reaction.
- Target melting temperature accurately reflects the intended PCR product.
- The empirical equation is applied only within typical PCR conditions.
- Reaction chemistry is assumed compatible with standard PCR annealing behavior.
- Primer sequences are assumed specific, correctly synthesized, and free of major defects.
- Magnesium, salt, and buffer concentrations are assumed suitable for the protocol.
- Polymerase performance is assumed consistent with its validated operating specifications.
- Instrument temperature calibration is assumed accurate and sufficiently uniform across wells.
- DNA quality and concentration are assumed adequate for reliable amplification.
- Calculated annealing temperature is an estimate requiring experimental verification before critical use.
- Reverse calculations assume the other two temperature values are valid and known.
- The calculator does not replace laboratory validation, manufacturer guidance, or professional judgment.
Results are rounded for display.
Internal calculations use full precision.
Formulas Used in Annealing Temperature Calculator :
Temperature Unit Normalization
All temperatures are normalized to the Celsius scale before the annealing calculation is performed. The same relationship is used in reverse when a result must be displayed in Fahrenheit or Kelvin.
Optimal Annealing Temperature
- TC
- Temperature expressed in degrees Celsius.
- TF
- Temperature expressed in degrees Fahrenheit.
- TK
- Temperature expressed in kelvins.
- Ta
- Calculated optimal PCR annealing temperature in degrees Celsius.
- Tm,primer
- Melting temperature of the less stable primer in degrees Celsius.
- Tm,target
- Melting temperature of the target PCR product in degrees Celsius.
Forward calculation uses the two melting temperatures to determine the annealing temperature. Reverse calculation algebraically solves this same equation for the missing temperature, so no separate empirical formula is required. Intermediate values retain full precision, and rounding is applied only to the displayed result. Price and cost calculations are not part of this calculator.
Variables & Definitions
View a complete list of all variables used in this calculator, including definitions and units
Annealing Temperature Calculator Variables and Units
| Symbol | Variable | Role | Unit | Calculation Use |
|---|---|---|---|---|
| TC | Temperature in Celsius | Normalized calculation temperature | °C | Base temperature scale used by the annealing formula. |
| TF | Temperature in Fahrenheit | Optional entered or displayed temperature | °F | Converted to Celsius before calculation and restored for display when selected. |
| TK | Temperature in Kelvin | Optional entered or displayed temperature | K | Converted to Celsius before calculation and restored for display when selected. |
| Ta | Annealing temperature | Calculated value or reverse-calculation input | °C | Optimal PCR annealing temperature determined by the locked calculation relationship. |
| Tm,primer | Primer melting temperature | Primary formula input or reverse-calculated value | °C | Melting temperature of the less stable primer with a weighting factor of 0.3. |
| Tm,target | Target melting temperature | Primary formula input or reverse-calculated value | °C | Melting temperature of the target PCR product with a weighting factor of 0.7. |
Unit Conversion Table
Celsius Temperature Conversion
| Unit Group | Unit Name | Symbol | Equivalent in °C | Used For |
|---|---|---|---|---|
| Popular Units | Degree Celsius | °C | TC = TC | Base calculation scale for primer, target, and annealing temperatures. |
Fahrenheit Temperature Conversion
| Unit Group | Unit Name | Symbol | Equivalent in °C | Used For |
|---|---|---|---|---|
| Popular Units | Degree Fahrenheit | °F | TC = (TF − 32) × 5/9 | Alternative temperature entry and display before Celsius normalization. |
Kelvin Temperature Conversion
| Unit Group | Unit Name | Symbol | Equivalent in °C | Used For |
|---|---|---|---|---|
| Scientific Units | Kelvin | K | TC = TK − 273.15 | Scientific temperature entry and display before Celsius normalization. |
Example Calculation
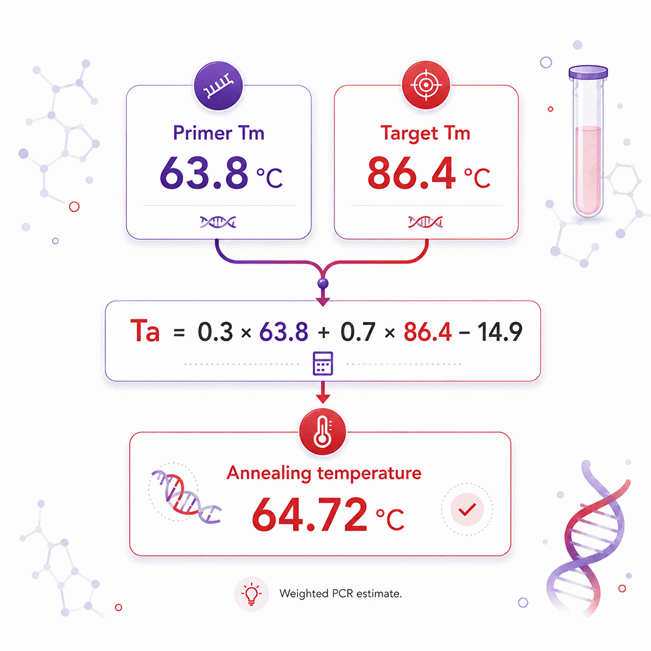
The primer melting temperature contributes 30% and the target melting temperature contributes 70% to the calculation. The fixed correction of 14.9 is then subtracted on the Celsius scale. Intermediate values remain unrounded until the final display step. The calculated 64.72 °C provides the estimated annealing temperature for these inputs.
Tm,primer = (Ta − 0.7 × Tm,target + 14.9) ÷ 0.3
Tm,target = (Ta − 0.3 × Tm,primer + 14.9) ÷ 0.7
TC = (TF − 32) × 5 ÷ 9
TC = TK − 273.15
TF = TC × 9 ÷ 5 + 32
TK = TC + 273.15
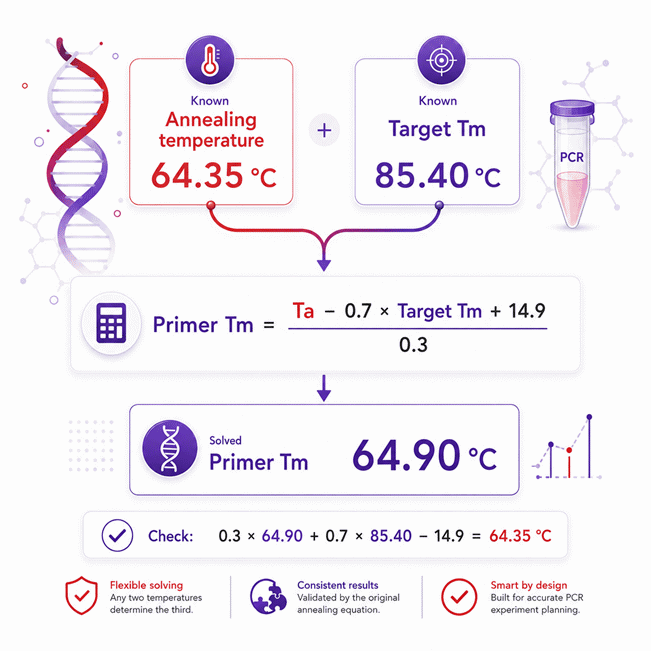
In reverse solving, the annealing temperature and target melting temperature are treated as known values. The original relationship is rearranged algebraically to isolate the missing primer melting temperature. Full numerical precision is retained during the calculation and rounding is applied only to the displayed result. Substituting 64.90 °C back into the original equation reproduces the known annealing temperature of 64.35 °C.
Ta = 0.3 × Tm,primer + 0.7 × Tm,target − 14.9
Tm,primer = (Ta − 0.7 × Tm,target + 14.9) ÷ 0.3
Tm,target = (Ta − 0.3 × Tm,primer + 14.9) ÷ 0.7
TC = (TF − 32) × 5 ÷ 9
TC = TK − 273.15
TF = TC × 9 ÷ 5 + 32
TK = TC + 273.15
Results are rounded for display.
Internal calculations use full precision.
Calculations Disclaimer
When PCR Looks Simple but the Annealing Step Changes Everything
A PCR run can fail even when the setup looks correct. The Annealing Temperature Calculator helps narrow that risk before cycling starts. The Annealing Temperature Calculator links primer behavior with the expected PCR product. It gives you a clear temperature target for planning. Yet the number is only useful when its biological context is understood.
The annealing step controls how primers bind to the DNA template. If binding is weak, amplification may become poor. If binding is too loose, unwanted regions may also amplify. That creates a difficult balance between yield and specificity. A useful temperature must support the intended primer-template match without encouraging weaker matches.
This is why PCR annealing temperature cannot be treated as a random setting. It is part of a larger reaction system. Primer design matters. Product characteristics matter. Polymerase chemistry also matters. Buffer conditions can change the practical result.
The calculator gives structure to that decision. It removes part of the guesswork from PCR planning. It also allows a user to work backward when needed. That becomes useful when an existing protocol has known temperatures but missing design data.
The most important idea is simple. A calculated temperature is a starting target, not laboratory proof. Good PCR work combines prediction with observation. That approach saves time when a reaction behaves differently than expected.
Quick Check: A clean calculation can still produce a poor PCR result.
Why Annealing Temperature Is More Than a Primer Tm Setting
A common problem starts with one assumption. Many users treat primer Tm as the annealing temperature. These values are related, but they are not identical. Primer melting temperature describes duplex stability under defined conditions. Annealing temperature describes the cycling condition used during PCR.
The difference matters because PCR is dynamic. Primers must bind during a short temperature window. The reaction also contains template DNA, salts, magnesium, nucleotides, and polymerase. Each part changes the local environment.
A useful calculator therefore needs a clear model. It should not silently mix unrelated methods. This project keeps one calculation approach throughout the tool. That makes results easier to understand and reproduce.
The user should also know which primer value is relevant. Primer pairs often have slightly different melting behavior. The less stable primer can become the limiting side. That is why primer balance matters before PCR optimization starts.
If primer values differ too much, temperature adjustment may not solve everything. A redesign can sometimes be more efficient. This is especially true when one primer binds well while the other struggles.
Why PCR Product Melting Behavior Also Deserves Attention
A second problem appears when users focus only on primers. The amplified DNA product also has melting behavior. Its sequence, length, and composition affect duplex stability. That information adds context to the annealing decision.
This matters because the PCR product is not just an endpoint. It is also part of the reaction environment during later cycles. As product accumulates, the system changes. A good model reflects more than primer behavior alone.
The target product should match the sequence you actually expect to amplify. A wrong target definition can distort the planning process. This becomes important when multiple amplicons are possible.
Good workflow starts with sequence certainty. Confirm the intended target first. Then confirm both primer sequences. Only then should temperature optimization become the next step.
This order prevents a common mistake. Users often adjust cycling conditions before checking sequence design. Temperature tuning cannot repair a primer that binds the wrong region.
Primer Tm, Product Tm, and PCR Ta Must Be Kept Separate
A confusing PCR report often mixes three different temperature terms. That creates mistakes before the reaction even starts. Primer Tm describes primer duplex stability. Product Tm describes the expected PCR product. PCR Ta describes the annealing step used during cycling.
These values should never be treated as interchangeable. Each one answers a different question. The calculator connects them through one consistent model. That makes the result easier to audit.
The practical benefit appears during troubleshooting. If a result looks strange, each value can be checked separately. This helps identify whether the issue comes from sequence data or reaction settings.
A good workflow also avoids hidden conversions. All temperature choices should represent the same physical value. Changing the displayed unit should not change the actual temperature. That keeps team communication clear across different systems.
For routine work, record the primer pair, expected amplicon, polymerase, and selected Ta. That small habit makes future troubleshooting much easier. It also prevents accidental reuse of a temperature from another assay.
How Primer Pair Balance Changes the Practical Decision
A frustrating PCR often begins with mismatched primer behavior. One primer may bind well while the other performs poorly. A single cycling temperature must still serve both primers.
Small Tm differences are usually easier to manage. Large differences create a narrower operating window. The reaction may favor one primer more than the other. That can reduce clean amplification.
Do not respond by changing Ta again and again. First verify the primer calculations. Use the same method for both primers. Then review complementarity and target specificity.
A poor primer pair can waste many optimization cycles. A balanced pair gives the reaction more room to succeed. This is one reason primer design should come before temperature fine-tuning.
When a Primer Redesign Can Be Faster Than More Optimization
A difficult reaction can tempt users into endless temperature testing. That can consume time and reagents. Sometimes the real problem is the primer itself.
Review primer specificity, self-complementarity, and pair compatibility. Check whether both primers target the intended region. Also check whether the expected product is unique.
If the design is weak, further temperature tuning has limited value. A better primer can solve several problems at once. It may improve specificity, yield, and repeatability.
This decision is especially important in important assays. A stable design reduces troubleshooting later. It also improves transfer between instruments and operators.
Too High or Too Low? PCR Gives Clear Warning Signs
A common PCR failure has one of two faces. The reaction produces almost nothing, or it produces too much noise. Annealing temperature can influence both patterns.
A higher temperature makes primer binding more selective. Weak matches are less likely to remain stable. This can improve specificity. Yet excessive stringency can reduce useful primer binding.
A lower temperature makes binding easier. That can improve yield when binding is weak. The same change can also encourage unwanted matches.
The useful setting lies between these extremes. You want enough binding for strong amplification. You also want enough selectivity for a clean product.
This balance is why a single number should not be viewed in isolation. Gel patterns, amplification curves, and reaction quality provide extra evidence. Use those signals together.
Watch the pattern: weak signal and extra bands point in different directions.
When Annealing Temperature Is Too High
A real problem appears when the expected product becomes faint. Sometimes no visible product appears at all. One possible cause is excessive annealing stringency.
At a high temperature, primers may not bind long enough. Fewer productive primer-template complexes can form. That can lower total amplification.
Do not immediately assume the primer design is wrong. Compare the chosen Ta with the expected primer behavior. Then test a controlled temperature change.
Other causes can create the same symptom. Poor template quality can reduce yield. Inhibitors can slow amplification. Incorrect reagent levels can also matter.
This is why troubleshooting should remain structured. Change one important factor at a time. Record the result after each change.
When Annealing Temperature Is Too Low
Another problem looks very different. The gel may show several unexpected bands. A smear may also appear. Low annealing stringency can contribute to this pattern.
At lower temperatures, weaker matches can survive. Primers may bind sequences that are not perfect targets. Those events can create unwanted products.
A small increase in Ta may improve specificity. Yet temperature is not the only cause. Primer design can also produce off-target binding.
Primer dimers deserve attention too. Complementary primer regions can interact with each other. Those interactions may compete with the intended target.
The fastest path is not random adjustment. First identify the visible failure pattern. Then choose the most likely variable to test.
Gradient PCR Turns a Prediction Into a Practical Decision
A calculated temperature can look perfect on paper. The real reaction may still behave differently. Gradient PCR helps test that uncertainty in one controlled run.
A gradient tests several nearby annealing temperatures. This creates a direct comparison under similar reaction conditions. You can then inspect specificity and yield together.
The best temperature is not always the strongest signal. A slightly weaker band may be much cleaner. For many assays, clean specificity is more useful than maximum intensity.
This is where careful observation becomes valuable. Look for a single expected product. Check whether background products disappear. Compare consistency between replicates.
Gradient testing also reduces guesswork. Instead of repeating many separate runs, you can explore a useful range efficiently. This can save time during assay development.
How to Read a Gradient Without Chasing the Strongest Band
A common mistake is choosing the lane with maximum brightness. Brightness alone does not define the best condition. A strong band with extra products may be less useful.
Start by checking specificity. Look for the expected product size. Then compare unwanted bands. After that, compare useful product strength.
The preferred condition often gives a clean and stable result. It should also tolerate small laboratory variation. A fragile setting can fail after minor changes.
Repeatability matters in routine work. A temperature should perform well across normal runs. This becomes especially important when several people use the same protocol.
Why a Narrow Follow-Up Gradient Can Save More Time
A wide gradient can identify the general working region. It may not identify the best final point. A second narrow gradient can refine the decision.
This step is useful when two nearby temperatures both look promising. Small differences may affect specificity more than expected. A narrow test can reveal that difference.
Once a stable condition is found, record it with full assay context. Include primer identity, template type, polymerase, and cycling program. That record becomes far more useful later.
Polymerase, Buffer, Magnesium, and Additives Can Change the Outcome
A PCR protocol may fail after a polymerase change. This can happen even when the primer pair remains identical. Reaction chemistry affects primer binding and enzyme behavior.
Different polymerase systems use different buffers. Salt composition can vary. Magnesium levels can vary. Some systems also include special enhancers.
That means an annealing setting should not be copied blindly. A temperature that works with one system may need adjustment elsewhere.
High-fidelity polymerases deserve extra care. Their recommended cycling conditions can differ from standard PCR systems. The safest approach is to respect the chemistry in use.
This does not make the calculator less useful. It makes the result more useful when interpreted correctly. The tool provides a structured starting point. The reaction system then defines the final laboratory choice.
Why Magnesium Can Change More Than Yield
A weak PCR often leads users to increase magnesium first. That can improve amplification in some cases. It can also reduce specificity.
Magnesium influences interactions inside the reaction. It affects polymerase activity and nucleic acid behavior. Changes can therefore alter the practical annealing window.
If magnesium changes, recheck the reaction rather than assuming everything else stays optimal. The same principle applies to major buffer changes.
Optimization works best when changes are documented. Random changes make cause and effect hard to identify.
Why GC-Rich Targets Need Extra Care
GC-rich templates can create difficult PCR behavior. Stable secondary structures may resist normal cycling conditions. Primer access can become less predictable.
Additives may help in some protocols. Yet additives can also change melting behavior. This can shift the practical annealing temperature.
When a GC-rich assay behaves poorly, avoid changing many variables together. Start with the most likely cause. Then use controlled testing.
The calculated Ta still provides a useful reference point. It simply needs more experimental context.
When the Temperature Looks Right but PCR Still Fails
This is one of the most frustrating laboratory situations. The calculated temperature looks reasonable. The reaction still fails.
At this point, stop adjusting Ta blindly. Check the whole workflow. Confirm primer sequences. Confirm the target sequence. Confirm reaction setup.
Template quality can be decisive. Damaged DNA can reduce amplification. Too little template can weaken detection. Too much template can also create problems.
Check reagent preparation next. Verify polymerase, buffer, magnesium, primers, and nucleotides. Confirm that the cycling program matches the planned protocol.
Instrument behavior also matters. A programmed temperature is only useful when the block performs correctly. Unexpected differences between instruments deserve attention.
Fast rule: if Ta looks correct, inspect the system before changing Ta again.
A Practical Troubleshooting Order for Faster PCR Recovery
Start with the simplest checks. Confirm that the correct primer pair was used. Confirm the template identity. Confirm the cycling program.
Next, inspect the reaction outcome. No product suggests different problems than multiple products. Weak product suggests another path.
Then review temperature. Compare the selected setting with primer behavior. If needed, run a controlled gradient.
After temperature, review chemistry. Check magnesium, buffer, additives, and polymerase conditions. Keep every change documented.
Finally, review primer design if the reaction remains unstable. Repeated failure may indicate a design problem. Endless temperature adjustments can hide that fact.
Using AxiCalculator as Part of a Repeatable PCR Workflow
A laboratory team can lose time when calculations live in separate notebooks. Small differences in recorded values can cause confusion. A shared workflow helps prevent that problem.
AxiCalculator keeps the temperature calculation in one clear interface. Users can work with the required temperature values directly. Reverse solving also supports protocol checks.
Independent unit controls make international teamwork easier. A user can view the preferred temperature scale without changing the physical value.
The export options support documentation. PDF output can capture a clean calculation record. Excel output can support further project tracking.
A shareable state also helps teamwork. Colleagues can open the same calculator state from a link. This reduces manual copying between messages and documents.
For recurring PCR work, consistency becomes a major benefit. The same logic is applied every time. That reduces small calculation differences between users.
Why Reverse Solving Is Useful for Existing PCR Protocols
Older protocols often contain incomplete design notes. A known annealing temperature may remain. The original primer or product calculation may be missing.
Reverse solving can help inspect that protocol. Known values can be used to infer the missing value within the same model.
This does not recreate lost laboratory measurements. It provides a mathematical consistency check. That distinction is important.
A large mismatch can signal a different design method. It may also show that the protocol was optimized experimentally. Both possibilities deserve review.
This feature is useful during method transfer. Teams can compare older settings with current design data. That makes hidden assumptions easier to find.
How Teams Can Reduce Errors During Method Transfer
Method transfer can fail even when the written protocol looks complete. Small details are often missing. Temperature logic is one of those details.
Keep the calculator result with the primer and product information. Record the polymerase system too. Include the final tested Ta after optimization.
When a new laboratory receives the method, those details reduce guesswork. They also make troubleshooting faster when equipment changes.
Shared calculation links and exported records can support this process. They create a clearer technical trail for future users.
Choose the Temperature That Solves the Real PCR Problem
The biggest risk is not choosing a slightly imperfect number. The bigger risk is treating one number as the whole experiment.
A strong PCR workflow begins with good sequence design. It then uses a clear temperature model. After that, the reaction is tested under real conditions.
When specificity is poor, look for weak binding rules and primer issues. When yield is poor, check excessive stringency and reaction quality. When results change between systems, review chemistry and instrument conditions.
This approach keeps troubleshooting focused. It also prevents unnecessary changes to several variables at once.
AxiCalculator is designed to make the calculation step fast and consistent. Its value becomes greater when the result is used inside a disciplined workflow.
Use the calculated Ta to plan intelligently. Use gradient testing when the assay is new. Record the final working condition for future runs.
That simple cycle creates a stronger process: calculate, test, observe, refine, and document. It turns a temperature estimate into a practical PCR decision.
Frequently Asked Questions
Can I use a calculated annealing temperature immediately for a new PCR assay?
Why can two laboratories get different PCR results using the same annealing temperature?
Should I change the annealing temperature when I replace one primer in an existing assay?
Can the calculator help when I only have an old PCR protocol and incomplete design records?
How should I handle a primer pair whose two melting temperatures differ more than expected?
What should I do if reverse solving gives a primer Tm that disagrees with my sequence-based Tm calculation?
How can I decide whether PCR failure is caused by temperature, primer design, or reaction chemistry?
Engineering Resources
Our engineers are here to help you get it right.