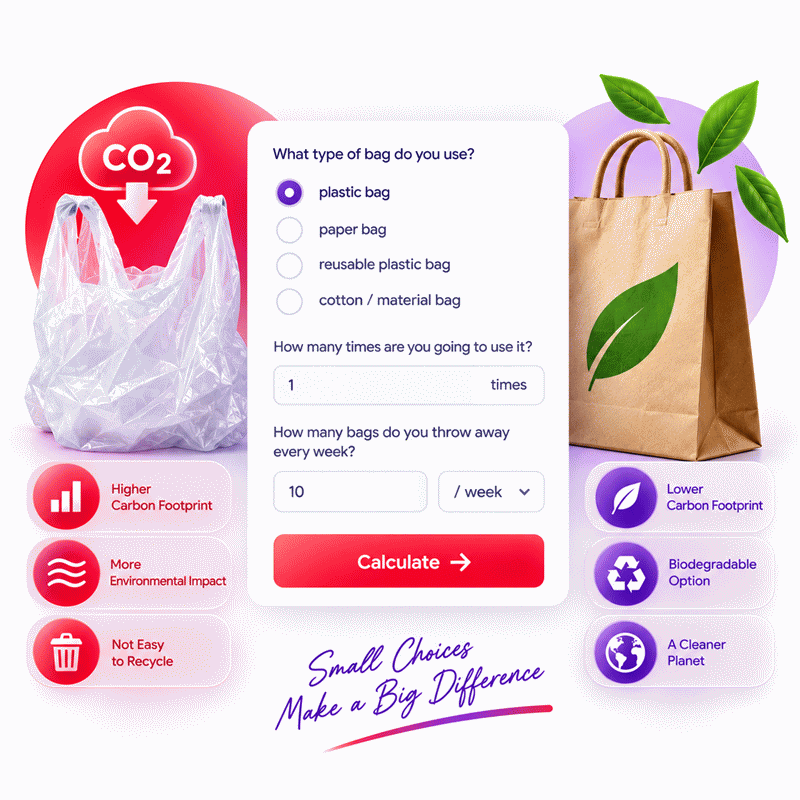
Bag Footprint Calculator
- Last formula update:
Decimal & Rounding Policy
- Calculations use full floating-point precision, with no rounding during intermediate steps.
- User-entered decimal values are accepted for reuse counts, disposal rates, and editable results.
- Standard results display up to 6 decimal places without unnecessary trailing zeros.
- Very large or very small results may use scientific notation for readability.
- Fixed bag comparison factors remain exact and are not altered by display rounding.
- Unit conversions are completed before final formatting to prevent cumulative rounding errors.
- Reverse calculations use unrounded values so recalculated inputs remain mathematically consistent.
Valid range
- Number of uses: greater than 0 and no more than 1e12 uses.
- Bag disposal rate: greater than 0 and no more than 1e12 in the selected rate unit.
- GWP ratio: greater than 0 and no more than 1e12 when entered for reverse solving.
- Discarded material: greater than 0 and no more than 1e12 in the selected mass-rate unit.
- Annual discarded bags: greater than 0 and no more than 1e12 in the selected count-rate unit.
- Only supported bag types and dimensionally compatible units are accepted.
- Empty, nonnumeric, nonfinite, zero, negative, unsupported, or out-of-range values are rejected.

Tivessa Zorquell
Reviewers:
Veralisse Noxmere
Sarven Kestthorne
Check our editorial policy
September 13, 2026
1.0.0
Initial calculator and formula release.
Our engineers are here to help you get it right.
What Does a Bag Footprint Calculator Tell You About Your Shopping Bags?
Bag Footprint Calculator results show how bag material, reuse count, disposal frequency, and bag mass change a shopping bag’s modeled environmental performance. The key insight is simple: a reusable label alone does not guarantee a lower footprint. Actual reuse determines whether the higher initial burden of a durable bag is spread across enough shopping trips.
- Reuse count is a critical driver of environmental performance per use.
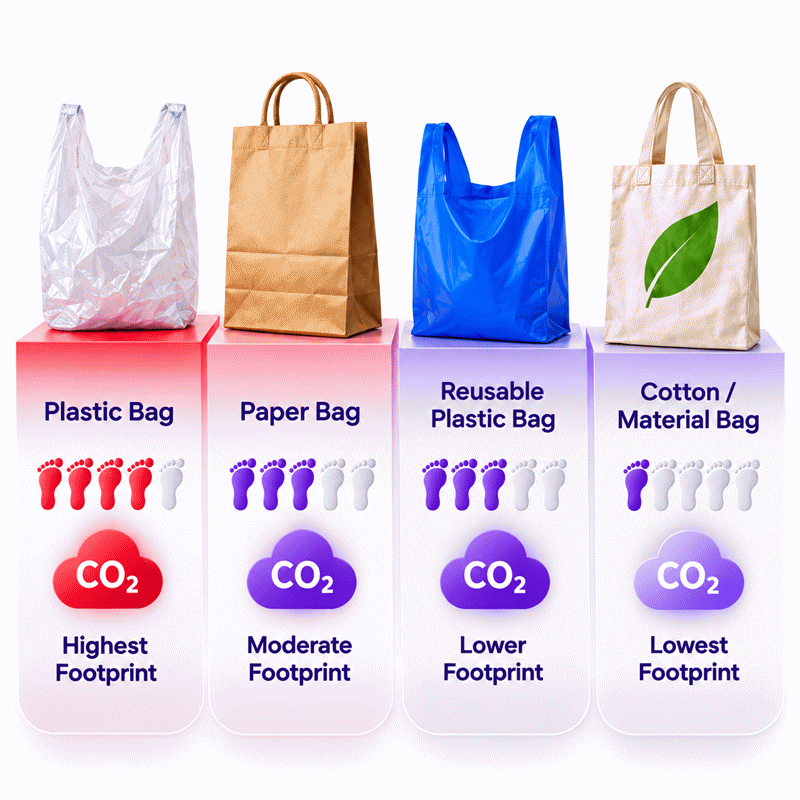
- Paper, reusable LDPE, and cotton reach break-even at different reuse levels.
- A GWP ratio of 1 represents parity with the calculator’s reference scenario.
- A ratio below 1 indicates lower modeled GWP per use than the reference.
- Weekly disposal rate helps reveal recurring bag consumption.
- Bag mass converts disposal frequency into estimated discarded material.
- Annual bag totals make small weekly habits easier to evaluate.
- Carbon results should not be treated as complete environmental rankings.
- Manufacturing, transport, recycling, litter, and local disposal can change real outcomes.
The Bag Footprint Calculator is most useful for comparing realistic reuse scenarios and identifying where longer service life or lower disposal can improve a bag-use pattern.
Assumptions used in this calculator
- Bag impact comparisons use fixed global warming potential reference factors.
- One conventional plastic bag represents the single-use comparison baseline.
- Paper bag break-even performance is modeled at three uses.
- Reusable LDPE bag break-even performance is modeled at four uses.
- Cotton bag break-even performance is modeled at 131 uses.
- Representative bag masses remain constant throughout each calculation.
- Plastic bag mass is modeled as 8.12 grams per bag.
- Paper bag mass is modeled as 55.20 grams per bag.
- Reusable LDPE bag mass is modeled as 34.94 grams per bag.
- Cotton bag mass is modeled as 183.11 grams per bag.
- Annual disposal estimates use exactly 52 weeks per year.
- Intermediate calculations retain full precision before result formatting.
- Actual environmental impacts may vary with production, reuse, and disposal conditions.
Results are rounded for display.
Internal calculations use full precision.
Formulas Used in Bag Footprint Calculator :
Unit Conversion to the Canonical Unit
Global Warming Potential Ratio per Use
Discarded Bag Material
Annual Discarded Bags
- Xdisplay = numeric value shown in the selected unit.
- ku = conversion factor from the selected unit to its canonical unit.
- Xbase = value converted to the calculator's canonical unit.
- U = planned number of uses of one bag.
- Fb = fixed GWP break-even reuse factor for the selected bag type.
- R = GWP ratio per use relative to the single-use plastic reference.
- Bw = discarded bags per week.
- mb = representative mass of the selected bag in grams per bag.
- W = discarded bag material in kilograms per week.
- A = discarded bags per year.
Variables & Definitions
View a complete list of all variables used in this calculator, including definitions and units
Bag Footprint Calculator Variables and Calculation Parameters
| Variable | Meaning | Canonical Unit | Type |
|---|---|---|---|
| Xdisplay | Numeric value displayed in the currently selected unit. | Selected unit | Input or result |
| ku | Conversion factor from a selected unit to its canonical unit. | Conversion factor | Fixed unit parameter |
| Xbase | Physical value converted into the calculator's canonical unit. | Canonical unit | Internal value |
| U | Number of times the selected bag is planned to be used. | uses | Input or reverse result |
| Fb | Fixed GWP break-even reuse factor assigned to the selected bag type. | uses | Bag parameter |
| R | Global warming potential ratio per use relative to the plastic reference. | dimensionless | Result or reverse input |
| Bw | Number of bags discarded during one week. | bags/week | Input or reverse result |
| mb | Representative mass of one selected bag. | g/bag | Bag parameter |
| W | Mass of discarded bag material generated each week. | kg/week | Result or reverse input |
| A | Estimated number of discarded bags over one year. | bags/year | Result or reverse input |
Unit Conversion Table
Bag Footprint Calculator Unit Conversion Reference
| Unit Group | Unit Name | Symbol | Equivalent in Canonical Unit | Used For |
|---|---|---|---|---|
| Use Count - Popular Units | Use | uses | 1 use = 1 use | Planned bag reuse count |
| Use Count - Scientific Units | Dimensionless Count | 1 | 1 = 1 use | Canonical reuse count |
| Bag Disposal Rate - Popular Units | Bags per Day | bags/day | 1 bags/day = 7 bags/week | Daily bag disposal rate |
| Bag Disposal Rate - Popular Units | Bags per Week | bags/week | 1 bags/week = 1 bags/week | Canonical bag disposal rate |
| Bag Disposal Rate - Popular Units | Bags per Month | bags/month | 1 bags/month = 0.230769 bags/week | Monthly bag disposal rate |
| Bag Disposal Rate - Popular Units | Bags per Year | bags/year | 1 bags/year = 0.019231 bags/week | Annual bag disposal rate |
| Bag Disposal Rate - Scientific Units | Bags per Second | bags/s | 1 bags/s = 604800 bags/week | High-rate scientific conversion |
| Discarded Material - Popular Units | Grams per Week | g/week | 1 g/week = 0.001 kg/week | Small weekly discarded material mass |
| Discarded Material - Popular Units | Kilograms per Week | kg/week | 1 kg/week = 1 kg/week | Canonical discarded material rate |
| Discarded Material - Popular Units | Pounds per Week | lb/week | 1 lb/week = 0.45359237 kg/week | Imperial weekly discarded material rate |
| Discarded Material - Popular Units | Kilograms per Year | kg/year | 1 kg/year = 0.019231 kg/week | Annualized discarded material mass |
| Discarded Material - Scientific Units | Grams per Second | g/s | 1 g/s = 604.8 kg/week | Scientific discarded material rate |
| Annual Bag Count - Popular Units | Bags per Year | bags/year | 1 bags/year = 1 bags/year | Canonical annual discarded bag count |
| Annual Bag Count - Popular Units | Bags per Month | bags/month | 1 bags/month = 12 bags/year | Monthly bag count converted to annual count |
| Annual Bag Count - Popular Units | Bags per Week | bags/week | 1 bags/week = 52 bags/year | Weekly bag count converted to annual count |
| Annual Bag Count - Scientific Units | Bags per Second | bags/s | 1 bags/s = 31557600 bags/year | Scientific annual bag count conversion |
| GWP Ratio - Popular Units | Reference Multiple | x | 1 x = 1 | GWP ratio per use |
| GWP Ratio - Scientific Units | Dimensionless Ratio | 1 | 1 = 1 x | Canonical GWP comparison ratio |
Example Calculation
- Bag type: Reusable LDPE bag
- Planned uses: 8 uses
- Discarded bags: 2.5 bags/week
- Break-even factor: 4 uses
- Bag mass: 34.94 g/bag
- GWP ratio per use: 0.5 x
- Discarded material: 0.08735 kg/week
- Annual discarded bags: 130 bags/year
- Reuse status: below the single-use plastic GWP reference
Using the reusable bag eight times reduces its modeled GWP ratio per use to 0.5.
The weekly disposal rate produces about 0.08735 kg of discarded bag material.
At the same disposal rate, the annual estimate is 130 discarded bags.
The environmental comparison improves as the same reusable bag is used more often.
- Bag type: Reusable LDPE bag
- Target GWP ratio per use: 0.25 x
- Break-even factor: 4 uses
- Discarded material: 0.10482 kg/week
- Bag mass: 34.94 g/bag
- Required planned uses: 16 uses
- Recovered disposal rate: 3 bags/week
- Annual discarded bags: 156 bags/year
- Target GWP ratio per use: 0.25 x
A target ratio of 0.25 requires the reusable LDPE bag to be used 16 times.
The specified discarded mass corresponds to three discarded bags each week.
That weekly rate converts to an estimated 156 discarded bags per year.
Reverse solving links the desired footprint ratio directly to the required reuse count.
Results are rounded for display.
Internal calculations use full precision.
Calculations Disclaimer
<p>This Bag Footprint Calculator provides comparative environmental estimates based on fixed bag characteristics, reuse assumptions, disposal rates, and global warming potential reference factors. Results are intended for educational, planning, and general sustainability assessment purposes and should not be treated as a site-specific life-cycle assessment, environmental certification, regulatory determination, or professional engineering conclusion. Actual environmental impacts can vary with bag manufacturing methods, material composition, transport distance, electricity mix, user behavior, secondary reuse, recycling, waste treatment, and local conditions. Industrial, commercial, regulatory, procurement, or investment decisions should be supported by current product-specific data and an appropriate professional life-cycle assessment when required.</p>
Which Shopping Bag Has the Lowest Environmental Footprint?
The wrong question is often, “Which material is greenest?” A better question is, “Which bag will I actually keep using?” Bag footprint can change sharply with reuse. A Bag Footprint Calculator makes that hidden variable visible. The Bag Footprint Calculator compares your selected bag with a reference shopping bag and shows how repeated use changes the result.
A lightweight plastic carrier uses little material. That helps explain its relatively low production burden in climate-focused comparisons. Yet plastic creates another problem. It can persist after disposal and become litter. A paper bag avoids some plastic-specific concerns, but producing it still requires material and energy. Cotton begins with a much larger production burden in the comparison used here. Its advantage depends on sustained reuse.
This creates a useful rule for daily decisions. Do not judge a bag by its label alone. Judge the bag by its complete use pattern.
A bag you already own has an important practical advantage. Its production has already happened. Replacing a usable tote simply because another material sounds greener can add another product to the system. Keeping a durable bag in service is often the more useful action.
The result also needs the correct environmental scope. A climate comparison does not automatically describe litter, marine pollution, water demand, toxicity, or every other lifecycle impact. A lower climate ratio should therefore be read as a climate result, not as a universal environmental score.
Why Reuse Count Can Change the Answer Completely
Imagine buying a reusable bag because its label says “eco.” You use it twice, forget it, then buy another. The material may sound sustainable, but the behavior has defeated the purpose.
Reuse spreads the initial impact of one bag across more shopping trips. If the modeled burden of a bag corresponds to a break-even factor F and the bag is used U times, its comparison ratio is F divided by U. More successful uses reduce that ratio.
This is why actual behavior matters more than an optimistic lifetime printed on packaging. A bag capable of 500 trips provides no 500-trip benefit when it is abandoned after five.
What the Break-Even Point Really Tells You
Break-even is a comparison threshold. At that point, the modeled global warming potential per shopping use reaches the reference level. A ratio above one remains above that reference. A ratio of one represents parity. A ratio below one means the selected bag has moved below the modeled reference on this specific metric.
That threshold is useful because it turns an abstract lifecycle result into a behavioral target. Instead of asking whether cotton or plastic is “good,” you can ask whether the cotton bag will remain in use long enough to justify its larger initial burden.
Why a Reusable Bag Is Not Automatically the Greener Choice
“Reusable” describes capability, not behavior. The environmental outcome depends on whether reuse actually occurs.
This distinction is especially important for businesses. Giving customers another tote may look sustainable. Yet distributing large numbers of bags that receive little use can work against the intended goal. A better program tracks durability, replacement rate, customer reuse, and unnecessary distribution.
Plastic, Paper, LDPE or Cotton: What Changes in Real Use?
A buyer standing at a checkout sees four materials. An environmental assessment sees four different production systems, weights, lifetimes, and disposal paths. That difference explains why simple material labels can mislead.
Plastic Bags: Low Material Use but Persistent Waste
Conventional HDPE carrier bags are lightweight. That small material requirement can produce a surprisingly low result in several production-focused lifecycle categories. However, this does not make plastic litter harmless.
The practical weakness appears after use. A bag that escapes collection can remain in the environment. Recycling availability also varies. For users, the sensible lesson is not to collect endless lightweight bags. Avoid unnecessary bags, reuse suitable ones, and dispose of them through an appropriate local route.
Paper Bags: When Reuse Changes the Climate Comparison
Paper often feels environmentally safer because users recognize it as fiber-based and recyclable. That impression does not remove its manufacturing burden.
In the comparison model used by this calculator, paper needs several primary uses to reach the climate reference. This makes durability important. A paper bag that tears after one wet shopping trip cannot deliver the same reuse pattern as one kept dry and reused several times.
Capacity also matters in professional comparisons. If two bags carry different amounts, comparing one physical bag against one physical bag may not represent the same service.
Reusable LDPE Bags: The Shorter Route to Break-Even
A thicker LDPE bag contains more plastic than a thin conventional carrier. The extra material raises its initial burden, but it also provides greater durability.
That trade-off can work well when reuse is consistent. The locked comparison model places its GWP break-even point at only a few primary uses. The practical requirement is simple: keep it available, reuse it, and avoid replacing it while it remains serviceable.
Cotton Bags: Why Long-Term Reuse Matters Most
Cotton presents the clearest lesson in lifecycle thinking. It feels natural, washable, and durable. Those features do not mean its production is impact-free.
The climate comparison used here assigns cotton a much higher reuse threshold than paper or reusable LDPE. A cotton tote therefore makes the most sense when it becomes a long-term object rather than a promotional giveaway used occasionally.
If you already own one, the key question is not whether another bag has a lower theoretical footprint. The useful question is how many more trips the existing tote can complete.
How Your Shopping Habits Change Your Bag Footprint
Two households can own identical bags and create very different outcomes. One keeps bags near the door and reuses them. The other repeatedly forgets them and accepts new bags. Material is identical; behavior is not.
Why Weekly Disposal Rate Matters
Weekly disposal reveals the flow of bags leaving your household or operation. That makes it useful for waste reduction.
Suppose a store department discards many reusable bags each week. The problem may not be material choice. It may be damage, poor storage, contamination, unnecessary distribution, or a process that treats reusable packaging as disposable.
Reducing the disposal rate can therefore expose a better operational opportunity than merely switching materials.
What Annual Bag Consumption Reveals
A weekly number can feel harmless. Annualization changes perception.
A small recurring disposal habit accumulates across 52 weeks. This makes annual bag count useful for households, campuses, offices, retailers, and waste audits. It also creates a baseline that can be measured again after a reuse program begins.
The goal is not to make an annual estimate look dramatic. It is to make a recurring process visible.
How Bag Weight Changes the Waste You Generate
Counting bags alone can hide an important difference. A thin HDPE bag and a heavy cotton tote are both “one bag,” yet their material masses differ greatly.
Waste mass combines disposal frequency with representative bag mass. This helps separate two questions: how many items are discarded, and how much material those items represent.
For professional work, measured product mass is preferable to a generic representative value. Product construction can vary by supplier, dimensions, thickness, handle design, and material blend.
When Does Your Reusable Bag Actually Become Worth Reusing?
The frustrating part of sustainable purchasing is that buying the “green” item does not complete the job. The benefit develops through future use.
How to Read a GWP Ratio Above or Below One
A ratio gives you a quick benchmark. Above one means the modeled impact per use remains above the reference. One means the two are level under the selected assumptions. Below one means the selected bag has crossed below the reference for global warming potential.
Do not turn that number into a broader claim. A ratio of 0.5 does not mean “50 percent of every environmental impact.” It describes the modeled comparison represented by that ratio.
Why Keeping a Bag Longer Can Matter More Than Buying Another
A new product restarts production demand. An existing serviceable bag does not need to be manufactured again simply because you continue using it.
This creates an overlooked decision rule: durability only becomes valuable when users exploit it. Keep bags visible. Store them where shopping begins. Return them to the car, bicycle basket, backpack, or entryway after unloading.
Small design choices in a routine can generate more reuse than good intentions.
The Hidden Environmental Trade-Offs Behind Shopping Bags
A single score is attractive because it simplifies decisions. Environmental systems rarely cooperate with that simplicity.
Carbon Is Important, but It Is Not the Whole Footprint
Global warming potential is one environmental indicator. It does not fully represent litter, marine impacts, toxicity, water use, land use, eutrophication, resource depletion, or local waste-management problems.
A bag can therefore perform well on one indicator and less well on another. Good environmental communication states the indicator being compared rather than turning one result into a universal sustainability ranking.
Manufacturing, Transport and End-of-Life Can Shift the Result
Production technology changes between suppliers and countries. Transport routes change. Recycled content changes. Electricity systems change. End-of-life routes change.
These differences matter most when a company wants to make a formal environmental claim. Generic screening values can help identify questions. They cannot replace supplier-specific data when a procurement or public claim requires product-level evidence.
Why Local Waste Systems Can Change Practical Outcomes
A material cannot be assumed to follow its ideal disposal pathway. A recyclable bag provides little recycling benefit when the local system does not accept it or when contamination prevents recovery.
Check the collection route that actually exists. For commercial facilities, examine what the waste contractor accepts. For households, use current municipal guidance rather than packaging assumptions.
How to Make a Better Bag Choice Without Greenwashing Yourself
The easiest sustainability mistake is buying something new to prove that you are consuming less. Bag decisions are a good place to break that cycle.
Start With the Bags You Already Own
Inventory first. Buying comes later.
Find the bags already in your home, vehicle, office, or warehouse. Remove damaged items that cannot safely perform their function. Put usable bags where they are likely to be remembered. This converts dormant products into useful capacity.
Match Durability to Your Real Shopping Routine
A delicate bag is a poor choice for repeated heavy loads. An oversized heavy bag may be unnecessary for small purchases.
Choose capacity, handle strength, cleanability, moisture resistance, and durability for the real task. A reusable product succeeds when its physical design supports repeated use without becoming inconvenient.
Avoid Decisions Based Only on Material Labels
Words such as natural, recyclable, reusable, biodegradable, and compostable describe properties. They do not provide a complete lifecycle result.
Ask better questions. How much material is used? How often will the bag be reused? What does it replace? How is it produced? What happens at end-of-life? Those questions create a more defensible decision than a label alone.
Bag Footprint Analysis for Students, Businesses and Sustainability Teams
A student needs transparent assumptions. A sustainability manager needs repeatable data. A buyer needs a defensible comparison. The same calculator can help all three, but the evidence required after calculation differs.
Using Bag Data for a Waste Audit
Start with observation rather than estimates where possible. Record bag type, quantities entering the process, reuse frequency, quantities discarded, representative mass, and disposal route.
Repeat the measurement after a defined period. A good intervention should change an observable metric, such as fewer bags issued, lower weekly disposal, greater reuse, or reduced waste mass.
A calculator then becomes a decision aid instead of a decorative sustainability number.
When a Calculator Is Not Enough for an Environmental Claim
Generic lifecycle values are useful for education and screening. They are not automatically suitable for product declarations, regulatory submissions, supplier claims, or comparative advertising.
Professional claims may require a defined functional unit, system boundary, primary supplier data, documented assumptions, uncertainty assessment, and formal lifecycle methodology. That is where a dedicated LCA becomes more appropriate.
Common Bag Footprint Mistakes That Can Reverse Your Conclusion
The first mistake is comparing materials without comparing the same service. Capacity and reuse must be consistent.
The second is assuming maximum durability equals actual reuse. A bag rated for hundreds of trips does not receive credit for trips that never happen.
The third is mixing environmental indicators. Carbon, litter, water, toxicity, and waste mass answer different questions.
The fourth is ignoring secondary reuse. A conventional bag later used as a bin liner can change the reference scenario because it replaces another product.
The fifth is treating a generic bag mass as a product specification. Industrial users should measure or obtain supplier data for the actual product.
The sixth is replacing a functional reusable bag too early. A new purchase creates another production event.
The seventh is treating a calculator result as a certification. It is a model output based on defined inputs and assumptions.
AxiCalculator is designed to make those inputs visible and the comparison easier to inspect. Use the result to understand your scenario, test alternatives, and identify where reuse behavior can improve. For formal environmental decisions, move from generic screening data to product-specific lifecycle evidence before making external claims.
Frequently Asked Questions
Is the bag with the lowest carbon result always the most environmentally friendly?
Should I buy a new reusable bag if I already own several bags?
Why can two reliable bag footprint studies report different break-even points?
What does a GWP ratio below one actually mean?
How should an engineer use generic bag masses in a commercial waste audit?
How should a sustainability team compare bags with different carrying capacities?
When is this calculator insufficient for a formal environmental claim?
Our engineers are here to help you get it right.