Kaya Identity Calculator
- Last formula update:

Decimal & Rounding Policy
- Calculations retain full numerical precision until the final displayed result.
- Calculated values are displayed with up to 12 significant digits when needed.
- Unit conversions occur before display formatting, preventing cumulative rounding errors.
- Very large or very small results may use scientific notation for readability.
- Reverse calculations use unrounded values to maintain consistency with the Kaya identity.
Valid range
- Population: Enter a positive value greater than 0 and up to 10,000,000,000,000 people.
- GDP per capita: Enter a positive value greater than 0 and up to 1,000,000,000 USD per person.
- Energy intensity of GDP: Enter a positive value greater than 0 and up to 1,000,000,000 kWh per USD.
- Energy carbon footprint: Enter a positive value greater than 0 and up to 1,000,000,000 kg CO2e per kWh.
- Impact: Enter or calculate a positive value greater than 0 and up to 1e30 kg CO2e.
- These limits are calculator safety boundaries rather than physical or scientific limits.

Tivessa Zorquell
Reviewers:
Veralisse Noxmere
Sarven Kestthorne
Check our editorial policy
September 13, 2026
1.0.0
Initial calculator and formula release.
Our engineers are here to help you get it right.
What Can a Kaya Identity Calculator Reveal About CO2 Emissions?
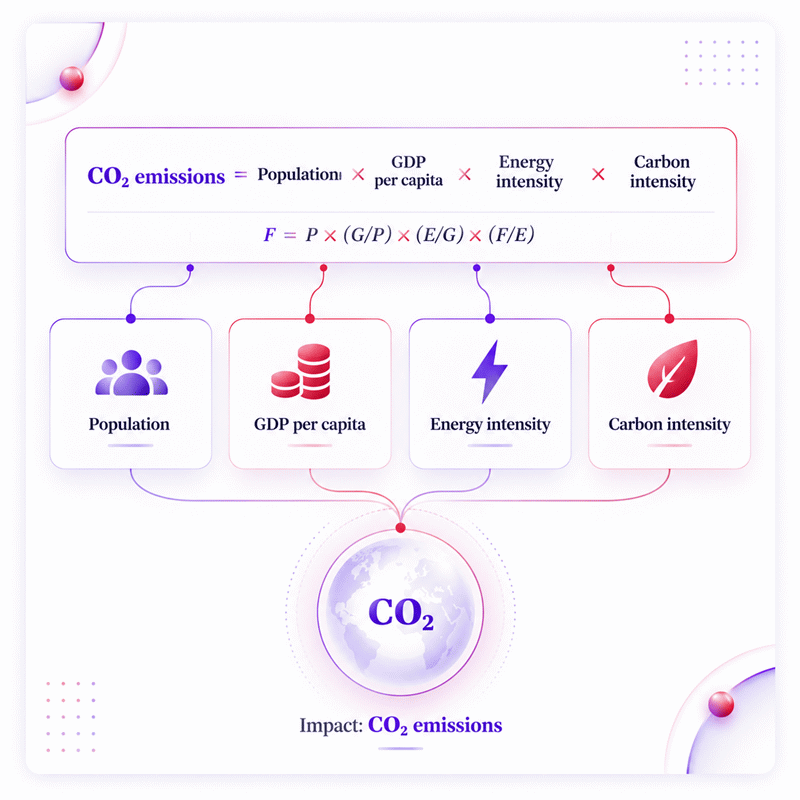
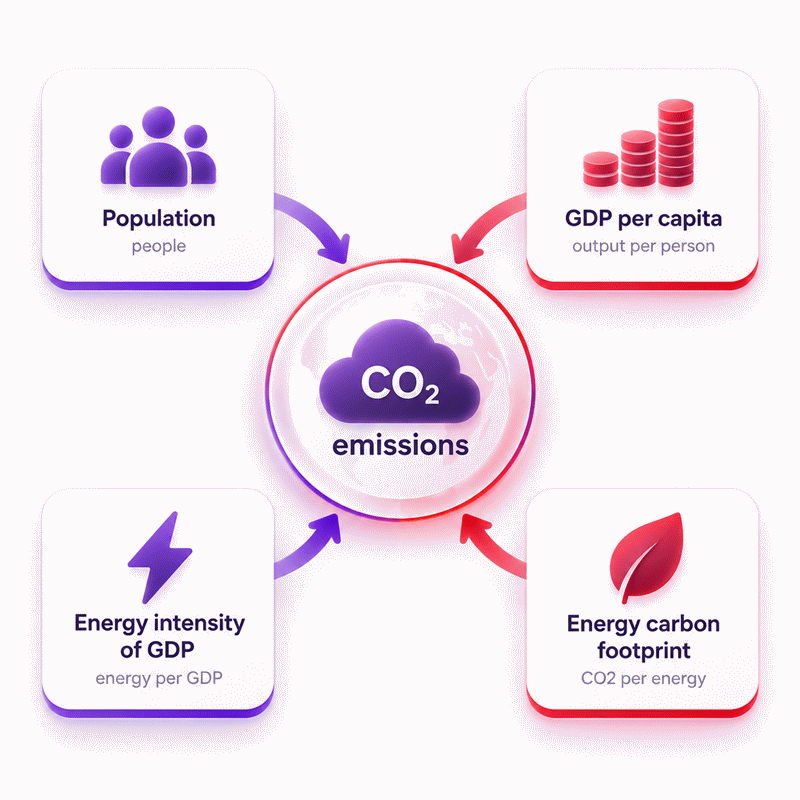
Kaya Identity Calculator analysis separates total CO2 emissions into four structural drivers: population, GDP per capita, energy intensity, and carbon intensity. Instead of treating emissions as one unexplained total, the framework shows how economic scale, energy efficiency, and the carbon content of energy combine.
- Population represents the scale of the population covered by the scenario.
- GDP per capita represents economic output for each person.
- Energy intensity shows energy required per unit of economic output.
- Carbon intensity shows emissions associated with each unit of energy.
- Lower energy intensity can reduce emissions pressure from economic growth.
- Lower carbon intensity represents a less carbon-intensive energy system.
- All four drivers interact, so one improvement may not offset growth elsewhere.
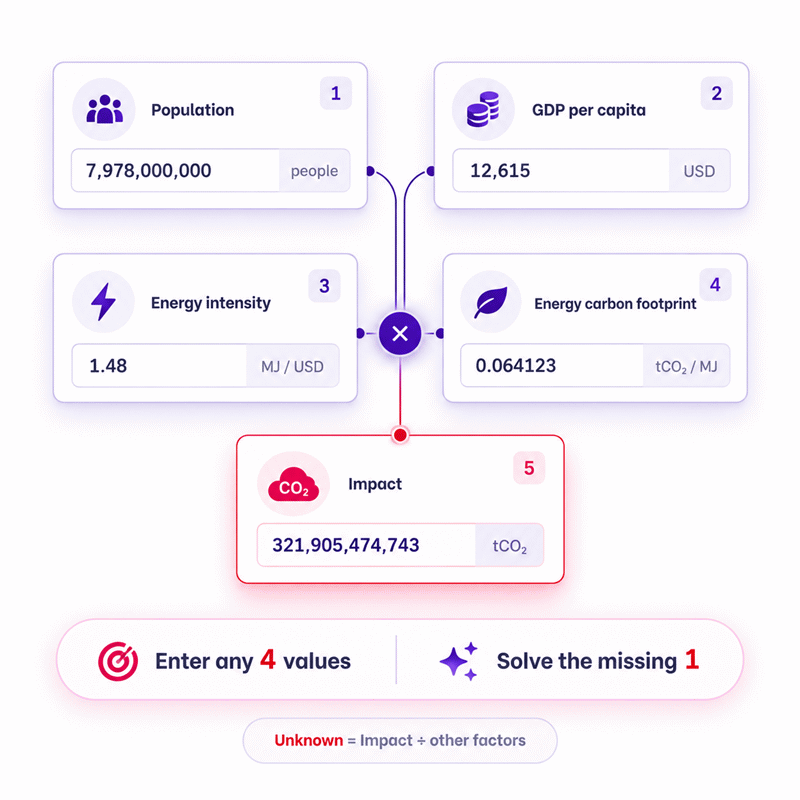
- Reverse solving can determine one unknown driver from four known quantities.
- Scenario results should use consistent geographic, economic, energy, and emissions boundaries.
The Kaya Identity Calculator is most useful for transparent scenario analysis, sensitivity testing, climate education, and high-level target screening. It helps users move beyond a single emissions total and ask the more useful question: which structural driver is changing the result?
Assumptions used in this calculator
- All input values are assumed to describe the same geographic scope.
- All input values are assumed to represent compatible reporting periods.
- GDP per capita is assumed consistent with the selected currency basis.
- Energy intensity is assumed compatible with the reported GDP definition.
- Carbon intensity is assumed representative of the modeled energy system.
- Input datasets are assumed accurate enough for the intended analysis.
- Unit conversions are assumed exact within defined conversion factors.
- Intermediate calculations retain precision and are not intentionally rounded.
- The Kaya identity is treated as an accounting relationship.
- Non-energy emission sources may require separate assessment outside this calculation.
- Historical and projected input values may produce materially different results.
- Industrial users should verify boundaries against their approved reporting methodology.
- Regulatory decisions should use validated data and qualified professional review.
Results are rounded for display.
Internal calculations use full precision.
Formulas Used in Kaya Identity Calculator :
Kaya Identity
- F = CO2 emissions impact.
- P = Population.
- G = Gross domestic product.
- E = Energy consumption.
- G/P = GDP per capita.
- E/G = Energy intensity of GDP.
- F/E = Energy carbon footprint.
Variables & Definitions
View a complete list of all variables used in this calculator, including definitions and units
Kaya Identity Calculator Variables and Units
| Variable | Quantity | Meaning | Calculator Reference Unit |
|---|---|---|---|
| P | Population | Total human population represented by the calculation. | people |
| G | GDP | Total gross domestic product associated with the population. | USD |
| E | Energy consumption | Total energy consumption associated with economic activity. | kWh |
| F | CO2 emissions impact | Total emissions represented by the Kaya identity result. | kg CO2e |
| G/P | GDP per capita | Economic output per person. | USD/person |
| E/G | Energy intensity of GDP | Energy consumed per unit of economic output. | kWh/USD |
| F/E | Energy carbon footprint | Emissions associated with each unit of energy consumed. | kg CO2e/kWh |
Unit Conversion Table
Population Unit Conversion Table
| Unit Group | Unit Name | Symbol | Equivalent in people | Used For |
|---|---|---|---|---|
| Popular Units | Person | people | 1 | Population |
| Popular Units | Million people | million people | 1,000,000 | Population |
| Popular Units | Billion people | billion people | 1,000,000,000 | Population |
| Scientific Units | Thousand people | thousand people | 1,000 | Population |
GDP per Capita Unit Conversion Table
| Unit Group | Unit Name | Symbol | Equivalent in USD/person | Used For |
|---|---|---|---|---|
| Popular Units | US dollars per person | USD/person | 1 | GDP per capita |
| Popular Units | Thousand US dollars per person | kUSD/person | 1,000 | GDP per capita |
| Scientific Units | Million US dollars per person | MUSD/person | 1,000,000 | GDP per capita |
Energy Intensity Unit Conversion Table
| Unit Group | Unit Name | Symbol | Equivalent in kWh/USD | Used For |
|---|---|---|---|---|
| Popular Units | Kilowatt-hour per US dollar | kWh/USD | 1 | Energy intensity of GDP |
| Popular Units | Watt-hour per US dollar | Wh/USD | 0.001 | Energy intensity of GDP |
| Popular Units | Megajoule per US dollar | MJ/USD | 0.2777777778 | Energy intensity of GDP |
| Scientific Units | Joule per US dollar | J/USD | 0.0000002777777778 | Energy intensity of GDP |
| Scientific Units | Kilojoule per US dollar | kJ/USD | 0.0002777777778 | Energy intensity of GDP |
| Scientific Units | Gigajoule per US dollar | GJ/USD | 277.7777778 | Energy intensity of GDP |
| Scientific Units | Megawatt-hour per US dollar | MWh/USD | 1,000 | Energy intensity of GDP |
Energy Carbon Footprint Unit Conversion Table
| Unit Group | Unit Name | Symbol | Equivalent in kg CO2e/kWh | Used For |
|---|---|---|---|---|
| Popular Units | Gram CO2e per kilowatt-hour | g CO2e/kWh | 0.001 | Energy carbon footprint |
| Popular Units | Kilogram CO2e per kilowatt-hour | kg CO2e/kWh | 1 | Energy carbon footprint |
| Popular Units | Gram CO2e per megajoule | g CO2e/MJ | 0.0036 | Energy carbon footprint |
| Scientific Units | Kilogram CO2e per gigajoule | kg CO2e/GJ | 0.0036 | Energy carbon footprint |
| Scientific Units | Tonne CO2e per megawatt-hour | t CO2e/MWh | 1 | Energy carbon footprint |
CO2 Emissions Impact Unit Conversion Table
| Unit Group | Unit Name | Symbol | Equivalent in kg CO2e | Used For |
|---|---|---|---|---|
| Popular Units | Tonne CO2e | t CO2e | 1,000 | Impact |
| Popular Units | Kilotonne CO2e | kt CO2e | 1,000,000 | Impact |
| Popular Units | Megatonne CO2e | Mt CO2e | 1,000,000,000 | Impact |
| Popular Units | Gigatonne CO2e | Gt CO2e | 1,000,000,000,000 | Impact |
| Scientific Units | Gram CO2e | g CO2e | 0.001 | Impact |
| Scientific Units | Kilogram CO2e | kg CO2e | 1 | Impact |
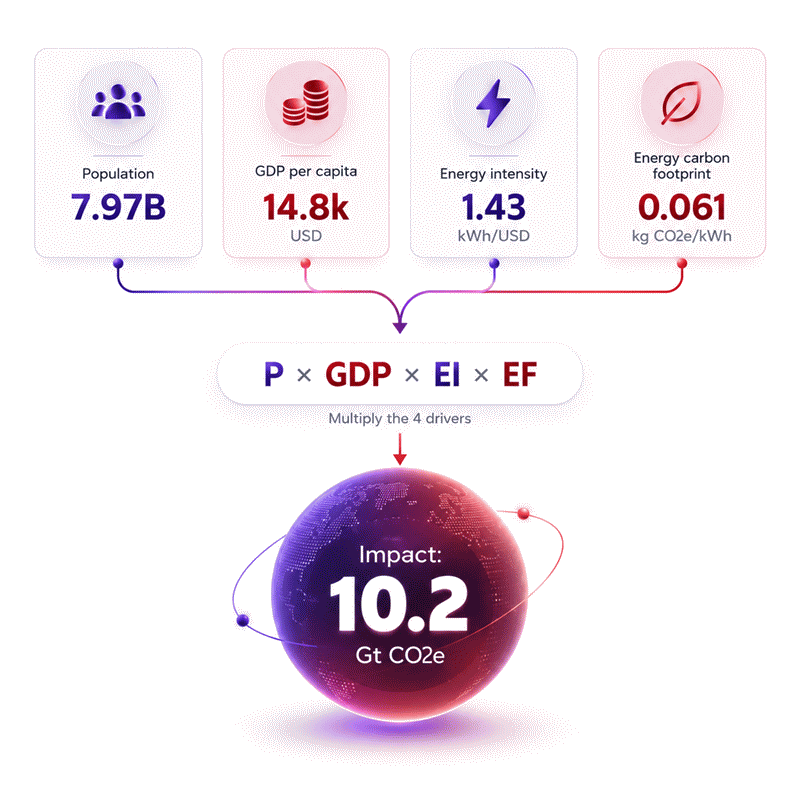
Example Calculation
Results are rounded for display.
Internal calculations use full precision.
Calculations Disclaimer
What Does a Kaya Identity Calculator Tell You?
A national emissions total can look simple while hiding several different forces. A Kaya Identity Calculator separates that total into population, economic output per person, energy use per economic output, and emissions per unit of energy. This makes the result easier to diagnose.
The key benefit is not another carbon number. It is visibility. Two regions may report similar emissions while reaching them through very different paths. One may have high economic output and efficient energy use. Another may have lower output but a much more carbon-intensive energy system. Looking only at total emissions hides that difference.
AxiCalculator turns these relationships into an interactive calculation. Change a factor and the result responds immediately. This makes scenario testing faster than rebuilding the calculation for every case. It also helps students, analysts, researchers, and sustainability teams see which assumption changed the result.
The tool should be read as a structural analysis tool. It connects economic activity and energy use to an emissions outcome. It does not tell you which policy is best. It also does not prove that one factor caused a historical change. Those questions need broader evidence.
The most useful question is therefore not simply, “What are the emissions?” Ask, “Which structural factor is creating this result?” That shift turns a static number into a decision aid.
Why Can the Same CO2 Total Hide Very Different Emissions Stories?
Imagine two economies with the same total emissions. The obvious conclusion is that their climate profiles are similar. That can be wrong.
One economy may serve a larger population with modest GDP per person. Another may have fewer people but far greater economic output per person. Their energy systems can also differ. A highly efficient economy needs less energy for each unit of output. A low-carbon energy mix then produces fewer emissions for each unit of that energy.
How Population Changes the Emissions Picture
Population acts as a scale factor. If every other Kaya factor stays unchanged, a larger population produces a proportionally larger calculated emissions total. That does not mean population alone explains emissions. It means population multiplies the effects of the other factors.
How GDP per Capita Changes the Kaya Identity
GDP per capita represents economic output per person. Higher values increase the calculated total when the other factors remain fixed. Yet GDP growth does not require emissions to rise at the same rate. Lower energy intensity or lower carbon intensity can offset part or all of that pressure.
This distinction matters when comparing development pathways. A country can become wealthier while using less energy for each unit of output. Its energy supply can also become less carbon intensive. The final emissions path depends on all four changes together.
What Energy Intensity Reveals About an Economy
A business or policy team may see energy demand rising and assume efficiency is getting worse. Total energy alone cannot answer that question. Economic output may also be rising.
Energy intensity focuses on energy used per unit of GDP. A lower value means less energy is required for the same measured economic output. That can reflect better equipment, more efficient buildings, improved industrial processes, structural economic changes, or several effects at once.
Why Lower Energy Intensity Can Change the Emissions Path
Suppose population and GDP per person increase. Those factors place upward pressure on emissions. Falling energy intensity pushes in the opposite direction. If the efficiency improvement is large enough, total energy demand can grow more slowly than economic output.
This is where scenario analysis becomes useful. Instead of assuming that economic growth and emissions must move together, change the energy-intensity factor and inspect the result. Then test carbon intensity separately. Finally, combine the changes.
That sequence helps prevent a common analytical mistake. If several inputs change at once, the final result changes, but it becomes harder to understand which assumption mattered. Testing one lever first creates a clean baseline.
What Carbon Intensity Reveals About the Energy System
An efficient economy can still produce high emissions when its energy supply is carbon intensive. Energy efficiency and energy decarbonization answer different questions.
Carbon intensity describes emissions per unit of energy. It captures the emissions character of the energy system represented by the data. Lower carbon intensity reduces the calculated emissions total when the other factors remain unchanged.
How Decarbonization Changes Total CO2 Emissions
Consider a scenario where economic activity stays constant. If the carbon intensity of energy falls, total modeled emissions fall in the same proportion when all other Kaya factors are unchanged. This direct relationship makes carbon intensity an important scenario lever.
However, the meaning of a carbon-intensity value depends on its boundary. Electricity-only data cannot automatically represent an entire primary-energy system. A national dataset may also treat fuels, imports, industrial processes, or electricity generation differently from another dataset.
That is why a technically neat result can still be misleading. The arithmetic can be correct while the datasets describe different systems. Good analysis checks the boundary before interpreting the number.
How the Four Kaya Drivers Work Together
A common planning problem appears when one factor improves but emissions still rise. This is not a contradiction. The Kaya drivers combine multiplicatively.
Why Multiplicative Effects Matter
Suppose energy intensity falls while population and GDP per capita rise. The efficiency gain reduces emissions pressure. Population and economic growth increase it. Carbon intensity can then amplify or offset the combined effect.
This interaction explains why isolated headlines can be misleading. “Efficiency improved” does not automatically mean “total emissions fell.” The correct question is whether the combined efficiency and decarbonization improvements were large enough to offset growth elsewhere.
Why One Improving Factor May Not Be Enough
Scenario testing is most useful when it exposes this tension. Start from a baseline. Reduce energy intensity. Record the change. Restore the baseline and reduce carbon intensity. Then test both improvements together. This sequence shows whether the two levers reinforce each other enough to change the total trajectory.
For professional analysis, preserve the same geographic scope and reporting period across scenarios. Otherwise, apparent improvements can result from mismatched data rather than genuine structural change.
How to Read a Kaya Identity Result Correctly
The calculator can return a precise number in milliseconds. The harder task is deciding what that number means.
Distinguishing a Calculation From a Forecast
A Kaya result is not automatically a forecast. It becomes a scenario result when you supply future assumptions. Those assumptions may be reasonable, aggressive, conservative, or unrealistic. The equation cannot judge them for you.
Use scenario labels that describe what changed. A baseline scenario might keep all factors constant. An efficiency scenario can reduce energy intensity. A decarbonization scenario can reduce carbon intensity. A combined scenario can change several drivers.
This approach makes comparisons easier to audit. It also helps another analyst understand why two outputs differ.
Understanding Data Boundaries Before Comparing Results
Country comparisons create another trap. GDP can be represented using different price bases. Energy can refer to primary energy, final energy, or another defined measure. Emissions datasets can include different sources.
Before comparing two results, ask whether each input describes the same conceptual boundary. A perfectly executed multiplication cannot repair incompatible source data.
How Reverse Kaya Identity Solving Helps Set Targets
Sometimes total emissions are not the unknown. The real question is what must change to reach a target.
AxiCalculator supports that workflow by allowing one quantity to become the unknown while the other four are known. This transforms the tool from a one-direction calculator into a target-testing environment.
Solving for a Missing Structural Driver
Suppose you know population, GDP per capita, carbon intensity, and a target emissions level. Energy intensity becomes the missing quantity. Solving backwards shows the energy intensity compatible with that target and those assumptions.
The same logic applies to carbon intensity. If population, GDP per capita, energy intensity, and target emissions are known, the required carbon intensity can be recovered.
This is useful because targets are often discussed before the structural pathway is clear. Reverse solving turns the question around: instead of asking what emissions result from current assumptions, ask what one driver must become to satisfy the target.
Using a Target Emissions Level to Test Required Change
The solved value is not a promise that the target is achievable. It is a mathematical requirement under the stated assumptions. Engineering feasibility, technology availability, investment, policy, infrastructure, and timing remain separate questions.
That distinction makes reverse solving valuable for screening. It can reveal when an assumption demands a very large change. Analysts can then investigate whether that change is plausible.
How to Compare Kaya Identity Scenarios
A scenario table becomes confusing when every input changes at once. Use a controlled comparison instead.
Change One Driver First, Then Test Combined Scenarios
Begin with a baseline that represents one consistent year and geography. Duplicate it. Change only population and observe the result. Repeat for GDP per capita, energy intensity, and carbon intensity.
Next, build combined scenarios. An efficiency-led case can focus on lower energy intensity. A cleaner-energy case can focus on lower carbon intensity. A broader transition case can combine both.
This workflow creates an audit trail. It shows what changed and why the result moved. It also reduces the temptation to attribute the full difference to whichever variable appears most interesting.
For teams, record the source year and scope beside every scenario. That small habit prevents many comparison errors later.
Common Kaya Identity Interpretation Mistakes
The most dangerous mistake is not a difficult equation. It is a confident interpretation built on inconsistent data.
Do not assume that a high GDP automatically causes high emissions. Do not treat lower energy intensity as proof that every industrial process became more efficient. Do not treat carbon intensity as a complete description of the entire energy transition unless the underlying data actually cover that system.
Why Correlation and Decomposition Are Not the Same as Causation
The Kaya framework decomposes an emissions total into structural factors. It does not by itself identify causal mechanisms. If carbon intensity falls during the same period as emissions fall, the identity can show how the arithmetic changed. Establishing why carbon intensity fell requires additional evidence.
Another mistake is mixing time periods. Population from one year, GDP from another, and energy data from a third can create a synthetic scenario that never existed. That may be acceptable when intentionally building a hypothetical case. It is poor practice when presenting the result as historical reality.
Finally, avoid reading more precision into the result than exists in the inputs. A calculator can process many digits, but source uncertainty remains.
When the Kaya Identity Is the Right Tool for Climate Analysis
Teams often need a fast way to understand an emissions problem before selecting a more complex model. This is where the Kaya Identity Calculator is strongest.
Use it when the question concerns the structural relationship among population, economic activity, energy intensity, carbon intensity, and total emissions. It works well for education, high-level scenario analysis, sensitivity checks, target screening, and transparent comparisons.
Use a more detailed model when the decision depends on individual technologies, hourly energy operation, sector-specific processes, lifecycle emissions, infrastructure constraints, or investment optimization. The Kaya framework intentionally compresses a complex economy into a few interpretable drivers.
AxiCalculator keeps that simplicity while adding practical reverse solving. You can test a forward scenario, set a target, remove one factor, and solve for the value required to make the relationship hold. This creates a useful bridge between learning the framework and testing real analytical questions.
The best result is not necessarily the lowest number on the screen. It is the result whose inputs, boundaries, and interpretation you can explain clearly. When another person can reproduce your reasoning, the calculator has done more than produce a number. It has made the scenario understandable.
Frequently Asked Questions
Can the Kaya Identity Calculator tell me which factor caused an emissions increase?
Why can two Kaya calculations for the same country produce different results?
Can I use the calculator to explore a future emissions target?
Is the Kaya Identity useful when total emissions are already known?
How should an engineer interpret an unusually low required energy intensity?
Can a reverse-solved carbon intensity be used as an electricity specification?
Why should a professional team preserve the original scenario inputs?
Our engineers are here to help you get it right.