Reduce Your Plastic Calculator
- Last formula update:
Decimal & Rounding Policy
- All calculations retain full internal precision, with no intermediate rounding.
- Converted editable values are rounded only when written back, to six decimal places maximum.
- Displayed results use four decimals below 10, three from 10 to 99.999, two from 100 to 999.999, and one from 1000 upward.
- Unnecessary trailing zeros are removed to keep plastic footprint results clear and readable.
- Estimated animal impact is rounded to the nearest whole animal.
- PDF values follow display rounding, while Excel formulas preserve calculation precision.
Valid range
- Current usage accepts values from 0 through 1,000,000,000 in a compatible selected unit.
- Goal usage accepts values from 0 through 1,000,000,000 and cannot exceed normalized current usage.
- Lifetime impact must be greater than 0 and no more than 120 years.
- Selected items require valid Current and Goal values during normal forward calculations.
- Reverse solving permits exactly one relevant Current or Goal field to remain unknown.
- An editable reverse result must be non-negative and no greater than 1,000,000,000.
- Only dimensionally compatible units supported by the corresponding selector are accepted.
- At least one plastic item must be selected before exporting or sharing complete results.

Tivessa Zorquell
Reviewers:
Veralisse Noxmere
Sarven Kestthorne
Check our editorial policy
September 13, 2026
1.0.0
Initial calculator and formula release.
Our engineers are here to help you get it right.
How Can the Reduce Your Plastic Calculator Help You Cut Everyday Plastic Use?
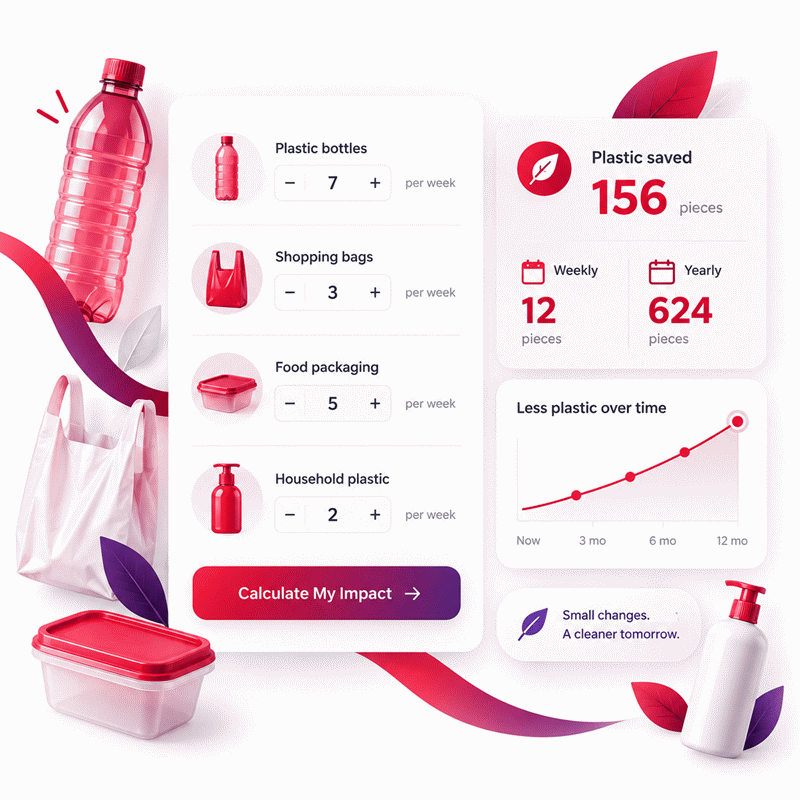
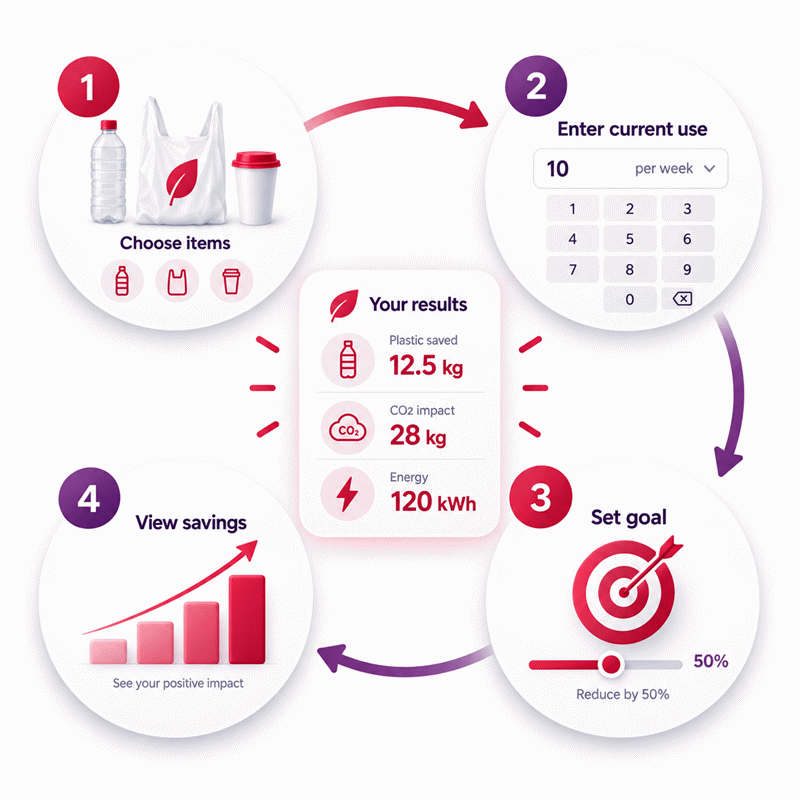
Reduce Your Plastic Calculator turns everyday disposable habits into a measurable reduction plan. Select the plastic products you use, enter your Current behavior, and set a realistic Goal. The calculator compares both scenarios and shows how changing recurring habits may affect annual plastic consumption and related impact estimates.
- Track food, kitchen, bathroom, laundry, packaging, and other plastic use.
- Compare your Current plastic footprint with a realistic future Goal.
- See annual plastic reduction as the main progress indicator.
- Review supporting carbon, energy, lifetime, and animal-impact estimates.
- Use reverse solving when one relevant input is unknown.
- Test different reduction goals before changing your daily routine.
- Focus first on disposable products that appear frequently.
- Use representative habits instead of an unusually busy or quiet period.
- Keep personal and household tracking scopes consistent.
- Export or share results when you need a reusable record.
The Reduce Your Plastic Calculator works best as a repeatable planning tool. Save your baseline, change one practical habit, review your behavior later, and keep the changes that fit your routine.
Assumptions used in this calculator
- Item weights represent approximate average plastic mass per disposable item.
- Daily, weekly, monthly, and yearly rates are annualized consistently.
- A year uses 365 days, 52 weeks, and 12 months.
- Current and goal values describe comparable usage periods and item types.
- Goal usage cannot exceed current usage for reduction estimates.
- Plastic mass is normalized to kilograms per year before impact calculations.
- Carbon impact uses 7 kilograms CO2e per kilogram of plastic.
- Energy impact uses 30 megajoules per kilogram of plastic.
- Lifetime savings assume the selected reduction remains constant each year.
- Animal impact scales with cumulative lifetime plastic reduction.
- Unit conversions preserve physical quantity without changing the underlying estimate.
- Reverse solving requires exactly one relevant usage value to be unknown.
- Results are estimates and do not replace product-specific life-cycle assessments.
Results are rounded for display.
Internal calculations use full precision.
Formulas Used in Reduce Your Plastic Calculator :
Annual Plastic Mass for Each Item
Total Current, Goal, and Annual Plastic Reduction
Carbon and Energy Impact
Lifetime Plastic Reduction and Animal Impact
Reverse Target Normalization
Reverse Residual for the Single Unknown
Reverse Value Returned to the Input
i = selected plastic item index.
u = the single unknown selected item index used in reverse solving.
x = usage scenario, where c is Current and g is Goal.
qi,x = count-based usage in the selected frequency unit.
ru = annualization factor: 365 for daily, 52 for weekly, 12 for monthly, and 1 for yearly usage.
wi = approximate plastic mass of item i in grams per item.
wu = approximate plastic mass of the unknown count-based item.
mi,x = direct plastic-mass input for the Other plastic category.
ku = factor converting the selected direct-mass unit to kilograms per year.
pi,x = annual plastic mass of one item in kilograms per year.
Pc = total Current plastic footprint in kilograms per year.
Pg = total Goal plastic footprint in kilograms per year.
S = annual plastic reduction in kilograms per year.
B = annual plastic basis used for Current, Goal, or reduction impact.
C(B) = carbon footprint in kilograms CO2e per year.
E(B) = energy footprint in megajoules per year.
Y = selected lifetime impact period in years.
L = lifetime plastic reduction in kilograms.
A = estimated animal impact before whole-number display rounding.
Rb = edited result converted from its selected display unit into its base result unit.
T = annual plastic-mass target recovered from the edited result.
Δu = annual plastic mass assigned to the single unknown item.
qu = solved count-rate value returned to the unknown input.
mu = solved direct-mass value returned to the unknown input.
Variables & Definitions
View a complete list of all variables used in this calculator, including definitions and units
Reduce Your Plastic Calculator Variables and Calculation Parameters
| Symbol | Variable | Meaning | Unit or Value | Calculation Role |
|---|---|---|---|---|
| i | Item index | Identifies a selected plastic item. | Dimensionless | Separates item-level plastic usage before totals are summed. |
| u | Unknown item index | Identifies the single item solved during reverse calculation. | Dimensionless | Used only when exactly one relevant input is unknown. |
| x | Usage scenario | Identifies Current or Goal usage. | c or g | Keeps current and goal footprints independent before comparison. |
| qi,x | Count-based usage | Number of disposable items used in the selected time period. | items/day, items/week, items/month, or items/year | Primary input for count-based plastic products. |
| ru | Annualization factor | Converts a count frequency into an annual count. | 365/day, 52/week, 12/month, 1/year | Normalizes count-based usage to one year. |
| wi | Approximate item plastic mass | PET bottle 25 g; bag 4 g; wrapper 3 g; yogurt container 8 g; cotton swab 0.2 g; detergent bottle 60 g; shampoo or cosmetic bottle 25 g; refill packet 15 g; toothbrush 20 g; toothpaste tube 13 g; take-away box 30 g; cup 12 g; straw 0.5 g; cutlery 5 g; plate 15 g. | g/item | Converts annual item counts into annual plastic mass. |
| mi,x | Direct plastic mass input | User-entered mass for the Other plastic category. | kg/year, lb/year, g/year, or kg/month | Handles plastic use already expressed as mass. |
| ku | Direct-mass conversion factor | Converts a direct mass input to kilograms per year. | 1, 0.45359237, 0.001, or 12 | Normalizes direct-mass inputs to the calculator base unit. |
| pi,x | Annual item plastic mass | Annual plastic footprint contributed by one selected item. | kg/year | Common normalized quantity used for all selected items. |
| Pc | Current plastic footprint | Sum of all current annual item plastic masses. | kg/year | Baseline annual plastic consumption. |
| Pg | Goal plastic footprint | Sum of all goal annual item plastic masses. | kg/year | Target annual plastic consumption. |
| S | Annual plastic reduction | Difference between current and goal annual plastic footprints. | kg/year | Base quantity for all reduction outputs. |
| B | Plastic impact basis | The annual plastic mass being evaluated for current, goal, or reduction impact. | Pc, Pg, or S | Feeds the carbon and energy impact equations. |
| C(B) | Carbon footprint | Carbon dioxide equivalent associated with the selected plastic basis. | kg CO2e/year | Uses 7 kg CO2e per kilogram of plastic. |
| E(B) | Energy footprint | Energy associated with the selected plastic basis. | MJ/year | Uses 30 MJ per kilogram of plastic. |
| Y | Lifetime impact period | Number of years over which annual reduction is projected. | years | Scales annual reduction into lifetime reduction. |
| L | Lifetime plastic reduction | Total plastic mass avoided over the selected lifetime period. | kg | Feeds the animal-impact estimate. |
| A | Animal impact estimate | Estimated animals protected by cumulative lifetime plastic reduction. | animals | Uses 34/62.4 animals per kilogram of lifetime plastic reduction. |
| Rb | Base reverse result | User-edited result after converting its selected display unit to its base result unit. | Depends on result type | Starting value for reverse target normalization. |
| T | Reverse plastic target | Annual plastic mass target recovered from an edited result. | kg/year | Defines the total or saved plastic amount required by reverse solving. |
| Δu | Unknown annual plastic mass | Annual plastic mass assigned to the single missing Current or Goal input. | kg/year | Residual after subtracting known item contributions. |
| qu | Reverse count result | Solved count-rate value returned to a count-based unknown field. | Selected count frequency | Converts the solved annual plastic mass back to item count. |
| mu | Reverse mass result | Solved direct-mass value returned to the Other plastic field. | Selected direct-mass unit | Converts the solved annual plastic mass back to the selected mass unit. |
Unit Conversion Table
Reduce Your Plastic Calculator Unit Conversion Table
| Unit Group | Unit Name | Symbol | Equivalent in Base Unit | Used For |
|---|---|---|---|---|
| Usage Frequency - Popular Units | Per Week | /week | 1/week = 52/year | Current and Goal count-based plastic item inputs |
| Usage Frequency - Popular Units | Per Month | /month | 1/month = 12/year | Current and Goal count-based plastic item inputs |
| Usage Frequency - Popular Units | Per Year | /year | 1/year = 1/year | Current and Goal count-based plastic item inputs |
| Usage Frequency - Scientific Units | Per Day | /day | 1/day = 365/year | Current and Goal count-based plastic item inputs |
| Direct Plastic Mass Input - Popular Units | Kilograms per Year | kg/year | 1 kg/year = 1 kg/year | Other plastic Current and Goal inputs |
| Direct Plastic Mass Input - Popular Units | Pounds per Year | lb/year | 1 lb/year = 0.45359237 kg/year | Other plastic Current and Goal inputs |
| Direct Plastic Mass Input - Scientific Units | Grams per Year | g/year | 1 g/year = 0.001 kg/year | Other plastic Current and Goal inputs |
| Direct Plastic Mass Input - Scientific Units | Kilograms per Month | kg/month | 1 kg/month = 12 kg/year | Other plastic Current and Goal inputs |
| Annual Plastic Mass Output - Popular Units | Kilograms per Year | kg/year | 1 kg/year = 1 kg/year | Current, Goal, and Saved plastic results |
| Annual Plastic Mass Output - Popular Units | Pounds per Year | lb/year | 1 lb/year = 0.45359237 kg/year | Current, Goal, and Saved plastic results |
| Annual Plastic Mass Output - Scientific Units | Grams per Year | g/year | 1 g/year = 0.001 kg/year | Current, Goal, and Saved plastic results |
| Annual Plastic Mass Output - Scientific Units | Metric Tons per Year | t/year | 1 t/year = 1000 kg/year | Current, Goal, and Saved plastic results |
| Lifetime Plastic Mass - Popular Units | Kilogram | kg | 1 kg = 1 kg | Lifetime plastic saved |
| Lifetime Plastic Mass - Popular Units | Pound | lb | 1 lb = 0.45359237 kg | Lifetime plastic saved |
| Lifetime Plastic Mass - Scientific Units | Gram | g | 1 g = 0.001 kg | Lifetime plastic saved |
| Lifetime Plastic Mass - Scientific Units | Metric Ton | t | 1 t = 1000 kg | Lifetime plastic saved |
| Carbon Footprint - Popular Units | Kilograms CO2e per Year | kg CO2e/year | 1 kg CO2e/year = 1 kg CO2e/year | Current, Goal, and Reduced carbon footprint |
| Carbon Footprint - Popular Units | Pounds CO2e per Year | lb CO2e/year | 1 lb CO2e/year = 0.45359237 kg CO2e/year | Current, Goal, and Reduced carbon footprint |
| Carbon Footprint - Scientific Units | Grams CO2e per Year | g CO2e/year | 1 g CO2e/year = 0.001 kg CO2e/year | Current, Goal, and Reduced carbon footprint |
| Carbon Footprint - Scientific Units | Metric Tons CO2e per Year | t CO2e/year | 1 t CO2e/year = 1000 kg CO2e/year | Current, Goal, and Reduced carbon footprint |
| Energy Footprint - Popular Units | Megajoules per Year | MJ/year | 1 MJ/year = 1 MJ/year | Current, Goal, and Reduced energy footprint |
| Energy Footprint - Popular Units | Kilowatt-hours per Year | kWh/year | 1 kWh/year = 3.6 MJ/year | Current, Goal, and Reduced energy footprint |
| Energy Footprint - Scientific Units | Kilojoules per Year | kJ/year | 1 kJ/year = 0.001 MJ/year | Current, Goal, and Reduced energy footprint |
| Energy Footprint - Scientific Units | Gigajoules per Year | GJ/year | 1 GJ/year = 1000 MJ/year | Current, Goal, and Reduced energy footprint |
Example Calculation
The calculation first converts every selected product into kilograms of plastic per year.
Current and Goal footprints are summed independently before their difference becomes the annual reduction.
The same annual plastic basis is then used for carbon, energy, and lifetime impact calculations.
Only the displayed results are rounded; the underlying calculations keep full precision.
The reverse calculation begins with the edited energy-reduction result and converts it back to annual plastic reduction.
The known Goal footprint is added to that reduction to recover the required Current plastic footprint.
The recovered annual plastic mass is then converted back into the selected bottle-frequency input.
Reverse solving remains deterministic because exactly one relevant usage field is unknown.
Results are rounded for display.
Internal calculations use full precision.
Calculations Disclaimer
What Does Your Plastic Footprint Reveal About Daily Habits?
Plastic use is easy to underestimate because most items disappear quickly. A bottle leaves your hand within minutes. A shopping bag may last one trip. A food wrapper disappears after one snack. Each event feels too small to matter alone. Repetition changes that picture. A clear footprint turns scattered habits into one measurable pattern. This makes reduction easier to plan. You stop guessing where plastic comes from. You can see which routines deserve attention first.
The Reduce Your Plastic Calculator organizes those habits around everyday product groups. You select what matches your routine. Then you compare current behavior with a realistic target. The aim is not perfection. The aim is useful measurement. A small change becomes easier to understand when its long-term effect is visible.
Why Small Disposable Habits Become Large Annual Totals
The common problem is repetition without awareness. One disposable item rarely feels important. The same item may appear dozens of times each month. That repetition creates the real opportunity for change. Tracking exposes habits that memory often hides.
A frequent purchase deserves attention before an unusual one. The calculator helps separate those patterns. You can test different goals without changing your routine first. This creates a safe planning space. You can see whether a proposed habit would make a meaningful difference.
One small item feels invisible. Repetition makes it visible.
Why Frequency Can Matter More Than the Size of One Item
A lightweight item can appear very often. A heavier item may appear rarely. Looking only at product size can mislead you. The better question is how often the item enters your routine. Frequency reveals which habits keep returning.
This is useful for bottles, bags, cups, wrappers, and disposable utensils. It also matters for bathroom products. Shampoo containers may appear less often. Their contribution can still become noticeable over longer periods. Tracking several categories creates a more balanced picture.
How Does the Reduce Your Plastic Calculator Turn Habits Into Action?
Many sustainability goals fail because they remain vague. “Use less plastic” sounds positive but lacks direction. The calculator turns that idea into a comparison. Your Current values describe the baseline. Your Goal values describe the behavior you want to maintain.
This structure creates a practical decision process. First, record your normal habits. Next, choose a realistic reduction. Then review the difference. The result helps you decide where effort is worthwhile. You can revise the goal before committing to it.
Track → Compare → Reduce → Review → Repeat.
Choose the Plastic Categories That Match Your Real Routine
A common mistake is measuring everything except the products used most often. Start with items you can recall confidently. Check food and kitchen habits. Review bathroom and laundry products. Include disposable containers and packaging. Add other plastic when standard categories do not fit.
You do not need to create an imaginary perfect week. Use a period that resembles normal life. Think about shopping, meals, work, travel, and personal care. That approach produces a baseline you can actually use later.
Compare Current Use With a Goal You Can Actually Maintain
An aggressive target can look impressive but fail quickly. A useful goal should survive normal life. Consider convenience, cost, availability, and household routines. A modest change that continues is more useful than a dramatic target abandoned quickly.
Try reducing one recurring category first. You might lower disposable bottle use. You might reduce shopping bags. You might change takeaway habits. The calculator lets you test these decisions before changing everything at once.
Use Reverse Solving When One Relevant Input Is Unknown
Sometimes you know the result you want, not the required habit. That creates a different planning problem. Reverse solving addresses it. Leave one relevant usage value unknown. Enter the target result that matters. The calculator can recover the missing input when the remaining values are sufficient.
This makes the tool useful for goal setting. You can work backward from a desired reduction. The result becomes a practical behavior target. That connection turns an abstract environmental goal into something easier to follow.
Which Everyday Plastic Categories Should You Track First?
People often start with the most visible object. Visibility does not always equal importance. A better first step is identifying repeated disposable behavior. Look for products that enter your home, bag, office, or car repeatedly.
High frequency + disposable design + low reuse = priority target.
This simple pattern helps prioritize effort. It also prevents distraction from rare purchases. Start where repeated behavior creates the clearest opportunity.
Food and Kitchen Plastics That Repeat Throughout the Week
Food routines can generate many small plastic items. Bottles, bags, wrappers, and containers appear during normal shopping. They can also appear during workdays and travel. Because these purchases repeat, they are useful starting points.
Review a normal week instead of relying on memory alone. Look at your kitchen bin. Check receipts if helpful. Think about snacks and drinks away from home. These observations can reveal habits that seemed insignificant before tracking.
Bathroom and Laundry Packaging That Is Easy to Forget
Bathroom waste is often underestimated because purchases happen less frequently. A detergent bottle may last weeks. Toothpaste packaging may disappear quietly. Cosmetic containers can accumulate across different products.
Review these items over a longer mental window. Think about what you replace each month. Consider refill options where they are practical. The purpose is not to eliminate useful products. It is to notice avoidable packaging and repeated replacement patterns.
Disposable Containers and Packaging That Accumulate Quickly
Convenience can hide a large number of disposable pieces. Takeaway meals may include cups, boxes, straws, and cutlery. One order can create several separate items. Repeated orders make the pattern easier to change.
Consider which parts are optional. You may not need disposable cutlery at home. A reusable cup may work for regular drinks. A reusable container can fit some routines. Choose changes that require little daily effort.
Other Plastic Use That Does Not Fit Standard Product Categories
Not every plastic item belongs in a simple product list. Households use many unusual plastic products. Some are occasional. Others repeat in specific lifestyles or workplaces.
The Other category gives you room for those cases. Use it when a standard item does not represent your situation. This keeps the calculator useful without forcing every habit into one predefined category. It also helps users with unusual purchasing patterns.
How Should You Read Your Plastic Reduction Results?
A result can look precise while still needing interpretation. The most useful question is what changed between scenarios. Current use provides context. Goal use shows the target. Saved plastic shows the modeled improvement.
Do not treat every output as an independent score. They describe different views of the same reduction plan. Start with annual plastic savings. Then use the supporting impacts for additional context.
The best result is not the biggest number. It is the change you can sustain.
Separate Your Current Footprint From Your Goal Footprint
Users sometimes focus only on the final reduction. That hides useful context. A reduction means more when you know its starting point. Current use shows the baseline. Goal use shows the intended future routine.
Keeping both visible makes progress easier to review later. You can return after several weeks. Then compare your real behavior with the original target. This turns the calculator into a planning tool instead of a one-time result.
Use Annual Plastic Savings as Your Main Progress Signal
Too many metrics can make a simple decision feel complicated. Start with one core number. Annual plastic saved is the clearest progress signal. It connects directly with the change between Current and Goal behavior.
Use that number to compare different reduction ideas. Test fewer bottles. Test fewer bags. Test fewer takeaway items. The larger opportunity may become obvious. You can then choose the change that feels realistic.
Read Carbon, Energy, Lifetime, and Animal Impact as Estimates
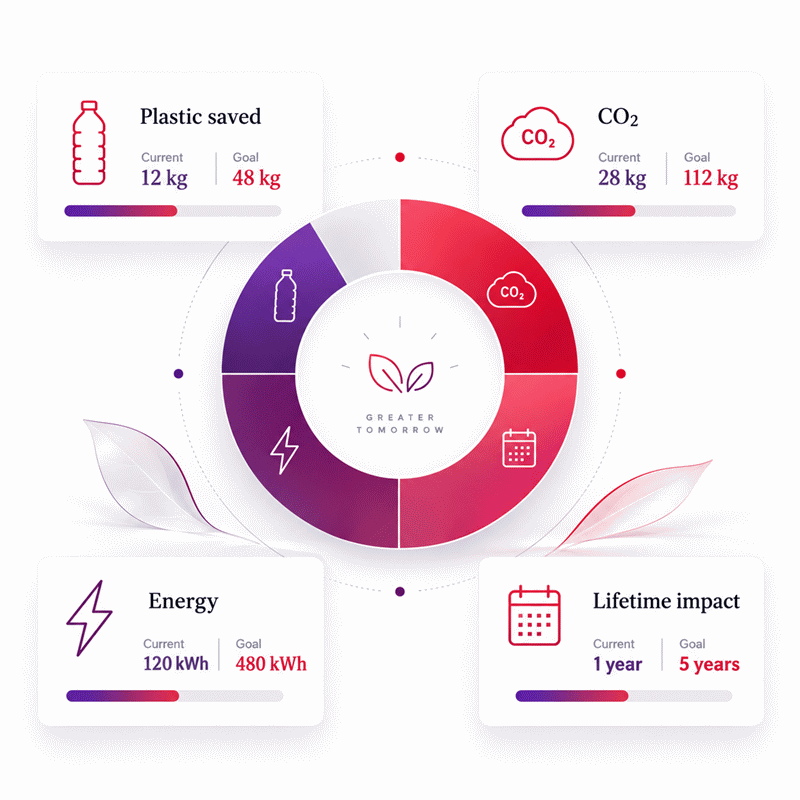
Supporting impact outputs can add useful perspective. They should not distract from the main behavior change. Carbon and energy estimates translate plastic reduction into additional impact views. Lifetime output shows what sustained behavior could accumulate over time. Animal impact adds another environmental perspective.
Use these outputs for understanding rather than competition. Your goal is not to chase the most dramatic number. Your goal is to identify a reduction you can maintain.
Where Can You Reduce Plastic Without Making Daily Life Harder?
Plastic reduction often fails when it creates too much friction. A successful change should fit existing routines. The easiest opportunities usually remove repeated disposable choices. They do not require constant attention.
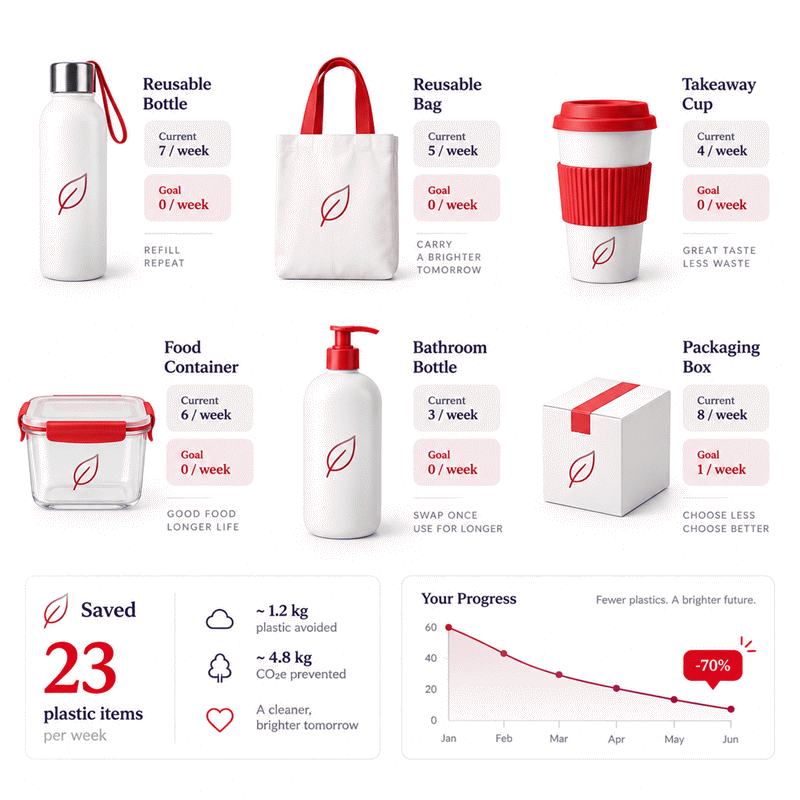
Keep reusable items where decisions happen. Store shopping bags near the door. Carry a bottle when leaving home. Keep reusable cutlery at work. Small placement decisions can remove repeated moments of choice.
Replace High-Frequency Disposable Items Before Rare Purchases
A rare plastic purchase may attract attention because it looks large. A small disposable product may appear hundreds of times. Repeated habits deserve priority.
Use the calculator to compare alternatives. Lower one frequent Current value toward a realistic Goal. Review the change. Then test another category. This approach helps you spend effort where it can create a larger recurring effect.
Use Refill and Reuse Habits Where They Fit Naturally
Reuse works best when the replacement is easy to reach. A reusable item hidden at home cannot help during a purchase. Convenience matters.
Place reusable products inside the routine they replace. Keep a bottle in your daily bag. Store reusable shopping bags near your normal exit. Use refill products when they fit your budget and local availability. Practical design supports better habits.
Build Reduction Goals Around Routines You Can Sustain
People often set goals for their ideal week. Real life is different. Work, travel, family schedules, and unexpected events change behavior. A sustainable goal needs room for those conditions.
Start with a target that feels achievable. Maintain it before tightening the goal. Review your progress later. Gradual improvement can reveal which changes feel natural and which create unnecessary friction.
Which Plastic Tracking Mistakes Can Distort Your Result?
A misleading baseline creates a misleading plan. The most common problem is poor recall. Another problem is mixing different scopes. A third problem is forgetting less visible products.
Good tracking does not require perfection. It requires consistency. Use the same definition of your routine each time. That makes later comparisons more meaningful.
Avoid Measuring an Unusually Busy or Quiet Week
A holiday week can distort normal consumption. So can illness or unusual travel. Pick a period that represents ordinary life. If your schedule changes often, consider several recent weeks.
You are building a baseline, not auditing every item forever. A representative period is usually more useful than an extreme one. The goal is practical comparison over time.
Do Not Mix Personal and Household Consumption Without a Clear Scope
Shared purchases can make tracking confusing. One person may buy household detergent. Everyone may use it. Food packaging may serve several people.
Choose one scope before recording values. Track yourself or track the household. Keep that decision consistent. A clear scope prevents future comparisons from becoming misleading.
Do Not Ignore Less Visible Bathroom and Packaging Waste
Visible drink bottles are easy to remember. Packaging inside cupboards is easier to forget. Bathroom products can disappear slowly. Delivery packaging may arrive irregularly.
Walk through each category before finishing your baseline. This simple review often reveals missing items. Better coverage creates a more useful reduction plan.
How Can You Turn One Calculation Into a Long-Term Plastic Reduction Plan?
A single result can create curiosity but no lasting change. Progress requires a repeatable process. Save the baseline. Choose one or two targets. Change the routine. Recheck later.
Do not change every category at once. Too many goals make progress harder to understand. Focused changes reveal what worked. You can then expand the plan with more confidence.
Measure first. Change one habit. Check again. Keep what works.
Save Your Baseline, Set a Goal, and Review Your Habits Again
Memory is unreliable after several months. Saved results preserve the original plan. Export or share the calculation when useful. This creates a simple reference point.
Return after your new habit has settled. Enter your updated behavior. Compare it with the original goal. If the target worked, maintain it. If it failed, adjust the routine rather than abandoning the entire plan.
Use AxiCalculator to Compare, Export, Share, and Revisit Your Progress
A plastic-reduction plan becomes more useful when it can travel with you. AxiCalculator lets you compare Current and Goal behavior in one place. You can review several impact outputs immediately. You can also work backward from a target when one relevant input is unknown.
Export options can help with records, projects, or classroom work. Sharing can support household goals or team discussions. Most importantly, the calculator gives you a repeatable measurement process. Use it again whenever your habits change.
Frequently Asked Questions
Can I use this calculator if my plastic habits change every week?
Should I enter plastic I recycle or only plastic I throw away?
What should I do if I do not know my exact weekly usage?
Which result should I watch if I only want one progress number?
How should a student document a calculator result in a project?
Can an organization use this result as an official plastic inventory?
When is reverse solving more useful than ordinary forward calculation?
Engineering Resources
Our engineers are here to help you get it right.