Cryptocurrency Footprint Calculator
- Last formula update:

Decimal & Rounding Policy
- Keep full floating-point precision throughout all intermediate cryptocurrency footprint calculations.
- Apply unit conversions before rounding so the underlying physical quantity remains unchanged.
- Display calculated energy, carbon, and comparison values with up to four significant digits.
- Trim unnecessary trailing zeros while preserving meaningful decimal precision.
- Display monetary totals to two decimals when appropriate and retain meaningful sub-dollar precision.
- Use scientific notation only for extremely small or large results that reduce readability.
- Perform reverse solving with unrounded values and round only the final displayed result.
Valid range
- Footprint mode: Energy, Carbon, or Climate only.
- Cryptocurrency: only a cryptocurrency available in the calculator’s selected historical dataset.
- Data year: 2018 or 2021 only; unsupported years must be rejected.
- Exchange price: finite and greater than 0, with a supported maximum of 1e15 USD/coin.
- Metal: only a metal available in the calculator’s comparison dataset.
- Metal market price: finite and greater than 0, up to 1e15 USD/kg.
- Hash rate: finite and greater than 0, up to 1e30 H/s.
- Power efficiency: finite and greater than 0, up to 1e6 J/hash.
- Block reward: finite and greater than 0, up to 1e12 coin/block.
- Block time: finite and greater than 0, up to 10080 min/block.
- Time period: greater than 0 and no longer than 100 years per calculation.
- Electricity emission factor: from 0 to 10 kg CO2e/kWh.
- Metal energy requirement: greater than 0 and up to 1e9 MJ/kg.
- Metal specific emissions: from 0 to 1e9 kg CO2e/kg.
- Social cost of carbon: from 0 to 1e6 USD/tCO2e.
- Calculated and reverse-solved values must remain finite and physically non-negative.
- Any reverse calculation requiring division by zero or an invalid denominator must be rejected.

Tivessa Zorquell
Reviewers:
Veralisse Noxmere
Sarven Kestthorne
Check our editorial policy
September 12, 2026
1.0.0
Initial calculator and formula release.
Our engineers are here to help you get it right.
What Can a Cryptocurrency Footprint Calculator Tell You Before You Trust the Result?
Cryptocurrency Footprint Calculator gives you a structured way to explore mining energy, carbon impact, and climate context without treating those metrics as identical. It helps you test how cryptocurrency selection, historical conditions, market value, mining intensity, electricity context, and comparison choices can change the result.
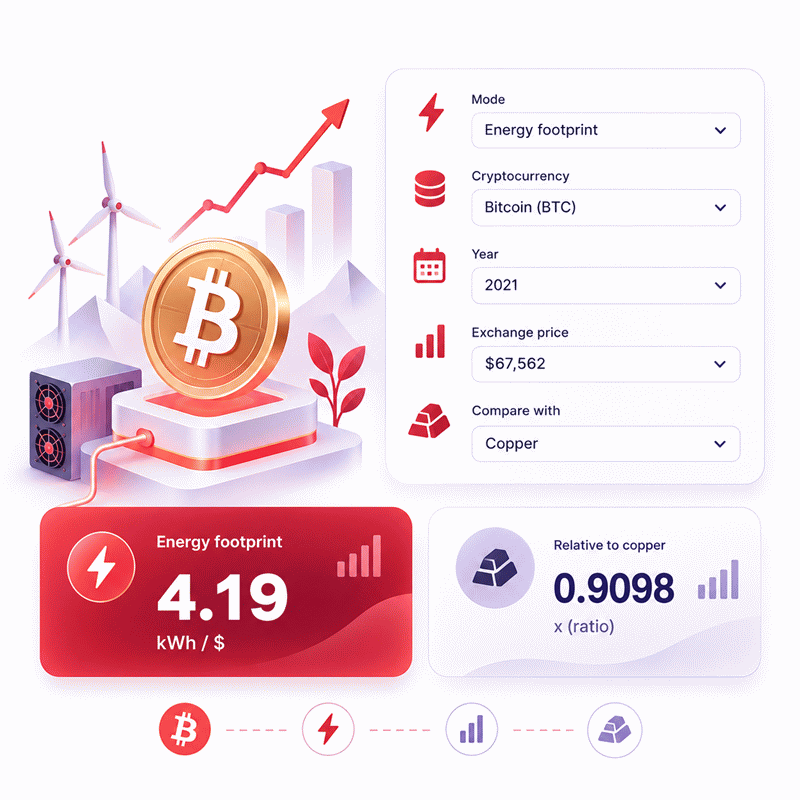
- Energy footprint shows the modeled electricity intensity of cryptocurrency mining.
- Carbon footprint adds the emissions associated with the selected electricity context.
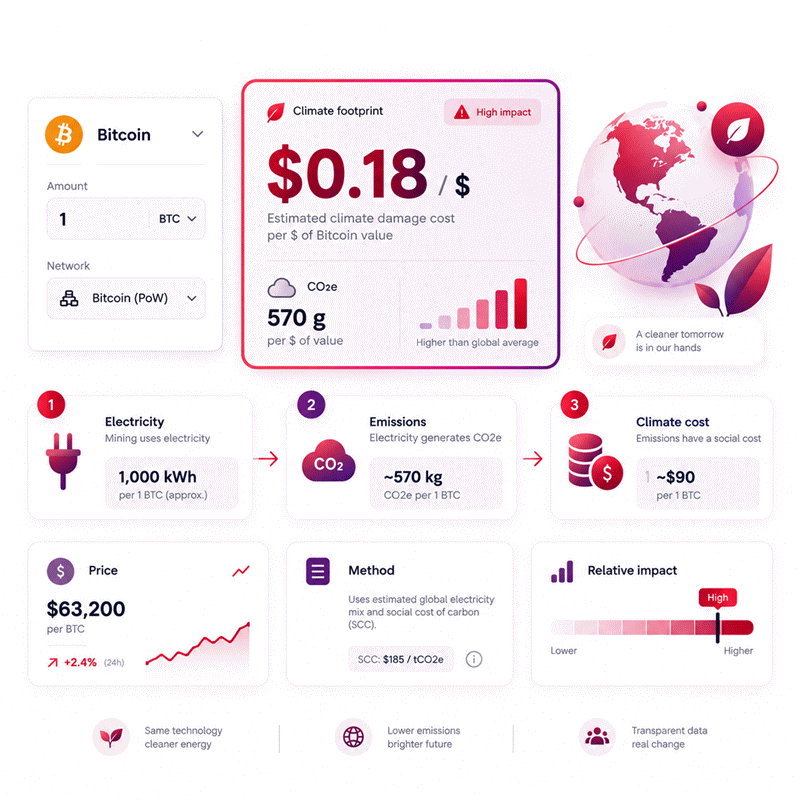
- Climate impact adds an economic interpretation to the modeled carbon emissions.
- Energy per coin and energy per dollar answer different analytical questions.
- Mining location can change carbon results without changing the underlying energy use.
- Value-normalized comparisons help place cryptocurrency and metal mining on one economic basis.
- Historical data should always be interpreted with its original network and market context.
- Reverse solving helps reveal which input would be required for a chosen target result.
The Cryptocurrency Footprint Calculator is most useful for scenario analysis, comparison, education, and technical screening. Use the result as a transparent model of the selected conditions, then verify material decisions with the most current operational data available.
Assumptions used in this calculator
- Mining network parameters represent the selected historical dataset rather than live network conditions.
- Hash rate and hardware efficiency are treated as period representative average values.
- Mining power is estimated from network hash rate and hardware energy efficiency.
- Block reward and block time remain constant throughout the selected calculation period.
- Exchange prices are scenario inputs and are not fetched from live markets.
- Metal energy and emission factors represent averaged industrial production intensities.
- Regional electricity intensity is applied uniformly across the selected mining period.
- Carbon estimates cover electricity-related mining emissions, not a complete life-cycle assessment.
- Climate damage uses the selected social cost of carbon without forecasting changes.
- All unit conversions preserve physical quantities before displayed values are rounded.
- Intermediate calculations retain full floating-point precision to minimize cumulative rounding error.
- Reverse solving requires nonzero denominators and physically valid positive target values.
- Results are estimates and should not replace audited operational environmental inventories.
Results are rounded for display.
Internal calculations use full precision.
Formulas Used in Cryptocurrency Footprint Calculator :
1. Cryptocurrency Energy Required per Coin
2. Cryptocurrency Energy Footprint per US Dollar
3. Metal Energy Required per Kilogram
4. Metal Energy Footprint per US Dollar
5. Energy Footprint Ratio
6. Carbon Emission per Coin
7. Coin Generation Rate
8. Coins Generated During the Selected Period
9. Total Cryptocurrency Carbon Emission
10. Cryptocurrency Carbon Footprint per US Dollar
11. Metal Carbon Footprint per US Dollar
12. Carbon Footprint Ratio
13. Economic Value Generated During the Selected Period
14. Net Economic Climate Damage
15. Economic Climate Damage per US Dollar Generated
16. Reverse Solving Relationships
Variables and Base Units
- Eref,c
- Historical cryptocurrency energy intensity at its stored reference price, in kWh/USD.
- Xref
- Stored reference cryptocurrency exchange price for the selected dataset, in USD/coin.
- Ecoin
- Energy required to generate one cryptocurrency coin, in kWh/coin.
- X
- User-selected cryptocurrency exchange price, in USD/coin.
- Ec
- Cryptocurrency energy footprint, in kWh/USD.
- Eref,m
- Stored metal energy intensity at its reference market price, in kWh/USD.
- Mref
- Stored reference market price of the selected metal, in USD/kg.
- Emkg
- Energy required to produce one kilogram of the selected metal, in kWh/kg.
- M
- User-selected market price of the comparison metal, in USD/kg.
- Em
- Metal energy footprint, in kWh/USD.
- RE
- Dimensionless cryptocurrency-to-metal energy footprint ratio.
- Y
- Electricity emission factor for the selected region, in kg CO2e/kWh.
- Ccoin
- Carbon emission associated with one generated cryptocurrency coin, in kg CO2e/coin.
- R
- Cryptocurrency reward generated per block, in coin/block.
- tb
- Average block production time, in seconds/block.
- q
- Estimated cryptocurrency generation rate, in coin/day.
- T
- User-selected calculation period, in days after unit conversion.
- N
- Estimated number of coins generated during the selected period, in coin.
- Ctot
- Total cryptocurrency carbon emission during the selected period, in kg CO2e.
- Cc
- Cryptocurrency carbon footprint, in kg CO2e/USD.
- Sm
- Specific carbon emission of the selected metal, in kg CO2e/kg.
- Cm
- Metal carbon footprint, in kg CO2e/USD.
- RC
- Dimensionless cryptocurrency-to-metal carbon footprint ratio.
- V
- Economic value of generated cryptocurrency during the selected period, in USD.
- SCC
- Social cost of carbon, in USD/tCO2e.
- D
- Estimated net economic climate damage, in USD.
- d
- Estimated climate damage per US dollar of generated cryptocurrency value, in USD/USD.
Variables & Definitions
View a complete list of all variables used in this calculator, including definitions and units
Cryptocurrency Footprint Calculator
| Symbol | Variable | Base Unit | Role in Calculation |
|---|---|---|---|
| H | Network hash rate | H/s | Total computational rate of the selected mining network. |
| η | Power efficiency | J/hash | Electrical energy required for each hashing operation. |
| P | Network power | MW | Estimated electrical power demand of the mining network. |
| R | Block reward | coin/block | Number of cryptocurrency units generated per mined block. |
| t_b | Block time | min/block | Average time required for the network to produce one block. |
| X | Exchange price | USD/coin | Market value assigned to one cryptocurrency unit. |
| v | Network economic velocity | USD/h | Economic value generated by block rewards per hour. |
| E_c | Cryptocurrency energy intensity | MJ/USD | Mining energy required to generate one US dollar of cryptocurrency value. |
| E_coin | Energy per coin | kWh/coin | Estimated electricity required to generate one cryptocurrency unit. |
| Y | Electricity emission factor | kg CO2e/kWh | Regional carbon intensity assigned to electricity consumed by mining. |
| C_coin | Carbon emission per coin | kg CO2e/coin | Estimated electricity-related emissions for one generated cryptocurrency unit. |
| T | Calculation period | h | Duration over which cumulative mining results are calculated. |
| N | Coins generated | coin | Estimated number of coins generated during the selected period. |
| C_tot | Total cryptocurrency emissions | tCO2e | Cumulative mining emissions over the selected calculation period. |
| E_mkg | Metal energy requirement | MJ/kg | Energy required to produce one kilogram of the selected metal. |
| M | Metal market price | USD/kg | Market value of one kilogram of the selected metal. |
| E_m | Metal energy intensity | MJ/USD | Metal-production energy required to generate one US dollar of value. |
| R_E | Energy footprint ratio | ratio | Cryptocurrency energy intensity divided by metal energy intensity. |
| S_m | Metal specific emissions | kg CO2e/kg | Carbon emissions associated with producing one kilogram of metal. |
| C_c | Cryptocurrency carbon intensity | kg CO2e/USD | Cryptocurrency mining emissions per US dollar of generated value. |
| C_m | Metal carbon intensity | kg CO2e/USD | Metal-production emissions per US dollar of generated value. |
| R_C | Carbon footprint ratio | ratio | Cryptocurrency carbon intensity divided by metal carbon intensity. |
| V | Generated cryptocurrency value | USD | Economic value generated by the network during the selected period. |
| C_m,tot | Equivalent metal emissions | tCO2e | Metal emissions associated with producing the same economic value. |
| SCC | Social cost of carbon | USD/tCO2e | Monetary climate-damage factor applied to total emissions. |
| D | Net economic climate damage | USD | Estimated monetary damage associated with cryptocurrency emissions. |
| d | Climate damage per generated dollar | USD/USD | Estimated climate damage normalized by generated cryptocurrency value. |
Unit Conversion Table
Cryptocurrency Footprint Calculator Complete Unit Conversion Table
| Unit Group | Unit Name | Symbol | Equivalent in Calculator Base Unit | Used For |
|---|---|---|---|---|
| Hash Rate - Scientific | Hash per second | H/s | 1 H/s | Base mining network hash rate |
| Hash Rate - Scientific | Kilohash per second | kH/s | 1,000 H/s | Low-rate mining networks |
| Hash Rate - Popular | Megahash per second | MH/s | 1,000,000 H/s | GPU-based mining rates |
| Hash Rate - Popular | Gigahash per second | GH/s | 1e9 H/s | Mining hardware and networks |
| Hash Rate - Popular | Terahash per second | TH/s | 1e12 H/s | ASIC mining performance |
| Hash Rate - Popular | Petahash per second | PH/s | 1e15 H/s | Large mining networks |
| Hash Rate - Popular | Exahash per second | EH/s | 1e18 H/s | Large-scale mining network hash rate |
| Hardware Efficiency - Popular | Joule per terahash | J/TH | 1e-12 J/hash | Modern ASIC mining efficiency |
| Hardware Efficiency - Popular | Joule per gigahash | J/GH | 1e-9 J/hash | Mining hardware efficiency |
| Hardware Efficiency - Popular | Joule per megahash | J/MH | 1e-6 J/hash | GPU-oriented mining efficiency |
| Hardware Efficiency - Scientific | Joule per hash | J/hash | 1 J/hash | Base hardware efficiency calculation |
| Network Power - Scientific | Watt | W | 0.000001 MW | Small electrical loads |
| Network Power - Popular | Kilowatt | kW | 0.001 MW | Mining hardware power |
| Network Power - Popular | Megawatt | MW | 1 MW | Base mining network power |
| Network Power - Popular | Gigawatt | GW | 1,000 MW | Large mining networks |
| Block Time - Popular | Second per block | s/block | 0.0166666667 min/block | Fast block-production intervals |
| Block Time - Popular | Minute per block | min/block | 1 min/block | Base block-time calculation |
| Block Time - Scientific | Hour per block | h/block | 60 min/block | Long block intervals |
| Cryptocurrency Price - Popular | US dollar per coin | USD/coin | 1 USD/coin | Cryptocurrency exchange price and reverse solving |
| Economic Velocity - Popular | US dollar per minute | USD/min | 60 USD/h | Short-period economic generation rate |
| Economic Velocity - Popular | US dollar per hour | USD/h | 1 USD/h | Base network economic velocity |
| Economic Velocity - Scientific | Thousand US dollars per hour | kUSD/h | 1,000 USD/h | Large network economic values |
| Energy Footprint - Popular | Kilowatt-hour per US dollar | kWh/USD | 1 kWh/USD | Base displayed cryptocurrency and metal energy footprint |
| Energy Footprint - Scientific | Megajoule per US dollar | MJ/USD | 0.2777777778 kWh/USD | Scientific energy-intensity data |
| Energy Footprint - Scientific | Kilojoule per US dollar | kJ/USD | 0.0002777778 kWh/USD | Low energy-intensity values |
| Energy Footprint - Scientific | Watt-hour per US dollar | Wh/USD | 0.001 kWh/USD | Low electricity-intensity values |
| Energy per Coin - Scientific | Watt-hour per coin | Wh/coin | 0.001 kWh/coin | Small per-coin energy values |
| Energy per Coin - Popular | Kilowatt-hour per coin | kWh/coin | 1 kWh/coin | Base cryptocurrency energy per coin |
| Energy per Coin - Popular | Megawatt-hour per coin | MWh/coin | 1,000 kWh/coin | Energy-intensive mining scenarios |
| Metal Energy - Popular | Kilowatt-hour per kilogram | kWh/kg | 1 kWh/kg | Base metal energy requirement |
| Metal Energy - Scientific | Megajoule per kilogram | MJ/kg | 0.2777777778 kWh/kg | Industrial metal energy datasets |
| Metal Energy - Scientific | Gigajoule per tonne | GJ/t | 0.2777777778 kWh/kg | Bulk industrial production data |
| Metal Energy - Scientific | Kilowatt-hour per tonne | kWh/t | 0.001 kWh/kg | Bulk metal electricity consumption |
| Metal Price - Popular | US dollar per kilogram | USD/kg | 1 USD/kg | Base comparison-metal market price |
| Metal Price - Popular | US dollar per gram | USD/g | 1,000 USD/kg | High-value metals |
| Metal Price - Popular | US dollar per pound | USD/lb | 2.20462262185 USD/kg | Commodity market quotations |
| Metal Price - Scientific | US dollar per metric tonne | USD/t | 0.001 USD/kg | Bulk industrial metal prices |
| Grid Carbon Intensity - Popular | Kilogram CO2e per kilowatt-hour | kg CO2e/kWh | 1 kg CO2e/kWh | Base electricity emission factor |
| Grid Carbon Intensity - Popular | Gram CO2e per kilowatt-hour | g CO2e/kWh | 0.001 kg CO2e/kWh | Electricity-grid emission intensity |
| Grid Carbon Intensity - Scientific | Gram CO2e per megajoule | g CO2e/MJ | 0.0036 kg CO2e/kWh | Energy-system emission datasets |
| Carbon per Coin - Scientific | Gram CO2e per coin | g CO2e/coin | 0.001 kg CO2e/coin | Low per-coin carbon emissions |
| Carbon per Coin - Popular | Kilogram CO2e per coin | kg CO2e/coin | 1 kg CO2e/coin | Base cryptocurrency carbon emission per coin |
| Carbon per Coin - Popular | Tonne CO2e per coin | tCO2e/coin | 1,000 kg CO2e/coin | High per-coin carbon emissions |
| Total Carbon - Popular | Kilogram CO2e | kg CO2e | 1 kg CO2e | Base cumulative cryptocurrency emissions |
| Total Carbon - Popular | Tonne CO2e | tCO2e | 1,000 kg CO2e | Large cumulative carbon emissions |
| Total Carbon - Scientific | Kilotonne CO2e | ktCO2e | 1,000,000 kg CO2e | Large-scale network emissions |
| Total Carbon - Scientific | Megatonne CO2e | MtCO2e | 1e9 kg CO2e | Very large cumulative emissions |
| Carbon Footprint - Popular | Kilogram CO2e per US dollar | kg CO2e/USD | 1 kg CO2e/USD | Base cryptocurrency and metal carbon footprint |
| Carbon Footprint - Popular | Gram CO2e per US dollar | g CO2e/USD | 0.001 kg CO2e/USD | Low carbon-intensity values |
| Carbon Footprint - Scientific | Tonne CO2e per US dollar | tCO2e/USD | 1,000 kg CO2e/USD | Very high carbon-intensity values |
| Metal Carbon - Popular | Kilogram CO2e per kilogram | kg CO2e/kg | 1 kg CO2e/kg | Base metal-production carbon intensity |
| Metal Carbon - Scientific | Gram CO2e per kilogram | g CO2e/kg | 0.001 kg CO2e/kg | Low-emission material datasets |
| Metal Carbon - Scientific | Kilogram CO2e per tonne | kg CO2e/t | 0.001 kg CO2e/kg | Bulk industrial reporting |
| Metal Carbon - Scientific | Tonne CO2e per kilogram | tCO2e/kg | 1,000 kg CO2e/kg | Extremely carbon-intensive materials |
| Time - Scientific | Hour | h | 0.0416666667 d | Short calculation periods |
| Time - Popular | Day | d | 1 d | Base calculation period |
| Time - Popular | Week | wk | 7 d | Weekly mining analysis |
| Time - Popular | Month | mo | 30.4375 d | Average calendar-month analysis |
| Time - Popular | Year | y | 365.25 d | Annualized mining analysis |
| Social Cost of Carbon - Popular | US dollar per tonne CO2e | USD/tCO2e | 1 USD/tCO2e | Base social cost of carbon |
| Social Cost of Carbon - Scientific | US dollar per kilogram CO2e | USD/kgCO2e | 1,000 USD/tCO2e | Mass-normalized climate damage cost |
| Social Cost of Carbon - Scientific | Thousand US dollars per tonne CO2e | kUSD/tCO2e | 1,000 USD/tCO2e | High climate-cost scenarios |
| Climate Damage - Popular | US dollar | USD | 1 USD | Base economic climate damage |
| Climate Damage - Popular | Thousand US dollars | kUSD | 1,000 USD | Medium climate-damage totals |
| Climate Damage - Scientific | Million US dollars | MUSD | 1,000,000 USD | Large climate-damage totals |
| Climate Damage - Scientific | Billion US dollars | BUSD | 1e9 USD | Very large climate-damage totals |
| Climate Damage Intensity - Popular | US dollar per US dollar | USD/USD | 1 USD/USD | Base climate damage per generated dollar |
| Climate Damage Intensity - Scientific | Cent per US dollar | cent/USD | 0.01 USD/USD | Small climate-damage intensities |
| Footprint Ratio - Popular | Dimensionless ratio | ratio | 1 ratio | Energy and carbon footprint comparison |
| Footprint Ratio - Scientific | Percent | % | 0.01 ratio | Percentage-form footprint comparison |
Example Calculation
The network parameters first determine estimated mining power and economic production velocity.
Energy intensity is then normalized by generated economic value, allowing direct comparison with metal production.
Regional electricity intensity converts mining energy into carbon emissions without changing the energy footprint.
The selected social cost of carbon converts cumulative emissions into an estimated monetary climate impact.
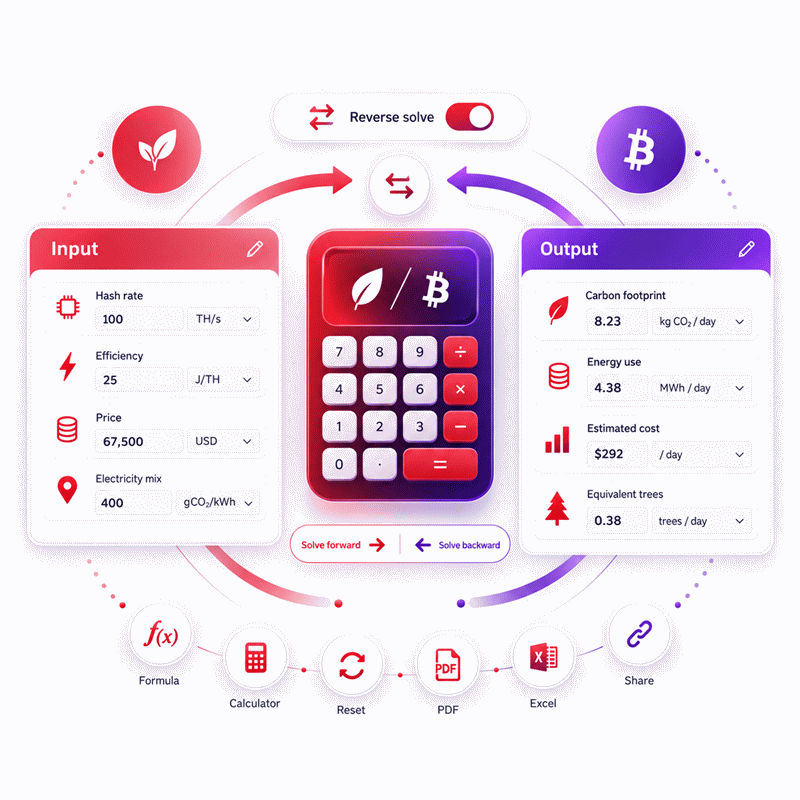
Reverse solving treats an editable calculated result as a known target and solves the missing dependent input.
The same forward equations are algebraically rearranged, so reverse mode does not use a separate estimation model.
Unit conversion occurs before inversion, and all intermediate calculations retain full numerical precision.
The recovered inputs can be substituted back into the forward equations to verify the requested targets.
Results are rounded for display.
Internal calculations use full precision.
Calculations Disclaimer
What Does a Cryptocurrency Footprint Calculator Actually Tell You?
A mining result can look precise while answering the wrong question. Cryptocurrency Footprint Calculator users often see energy, carbon, and climate numbers together. The Cryptocurrency Footprint Calculator separates those ideas before they become confusing. Energy describes electricity demand. Carbon adds the emissions linked to that electricity. Climate impact adds an economic interpretation to those emissions.
This distinction matters because one number cannot describe every environmental question. A mining network can use the same electricity while its carbon impact changes. The reason may be a different electricity mix. A cleaner grid can reduce emissions without changing mining energy. The opposite can happen on a carbon-heavy grid.
The economic basis also matters. A result expressed per coin answers one question. A result expressed per dollar answers another. A network total answers something different again. The denominator is part of the meaning. Removing it can turn a useful number into a misleading headline.
AxiCalculator is designed for scenario analysis rather than passive reading. You can change the cryptocurrency, historical data context, exchange price, comparison metal, and environmental inputs. The results react as the scenario changes. This lets you ask a better question than “Is crypto bad?” You can ask what specifically drives the selected footprint.
This approach is useful for students, analysts, engineers, sustainability teams, and curious users. Each group may start with a different goal. A student may need to understand mining intensity. An engineer may want to test hardware assumptions. An ESG analyst may care more about electricity location. A decision-maker may need a clear comparison between two scenarios.
The calculator is most useful when you treat the result as a model. It is not a power meter attached to every mining machine. Mining networks are distributed across many devices and locations. Their hardware changes. Their economics change. Their geography changes. That makes context essential.
The practical advantage is control. Instead of accepting a single environmental number, you can explore why it changes. That makes the result easier to question, explain, and use responsibly.
Why Can Cryptocurrency Mining Footprint Change Without More Transactions?
A common problem starts when transaction activity is mistaken for mining demand. Proof-of-work miners compete for block rewards. Their machines continue hashing whether a block carries many transactions or fewer transactions. This means transaction count is not a direct throttle for network electricity.
That difference changes how you should read environmental claims. Dividing total network energy by transactions creates an allocation. It does not measure electricity physically triggered by one payment. If the same network energy is divided by fewer transactions, the apparent per-transaction value rises. Nothing necessarily changed inside the mining hardware.
Mining economics create another effect. A valuable block reward can support more competition. More miners may remain profitable. Network hash rate can increase. Yet hardware may also become more efficient. The final energy outcome depends on both forces.
This is why a simple statement like “new hardware saves energy” can fail at network scale. One machine may use fewer joules for the same computational work. Thousands of additional efficient machines can still increase total electricity demand. Efficiency is a technical property. Total demand is a system result.
Market price can create another surprise. Energy per dollar uses economic value as its denominator. If market value rises while physical energy per coin stays similar, energy per dollar can fall. The network did not magically become more efficient. The economic denominator changed.
The reverse can also happen. A falling price can make the value-normalized footprint look worse. This is one reason historical results need their original context. Comparing two years without considering price, reward, hardware, and network conditions can hide the cause of the difference.
For a practical review, start with the question you need answered. Use network-level values when studying aggregate demand. Use per-coin values when studying production. Use per-dollar values when comparing economic intensity. Avoid treating these metrics as interchangeable.
AxiCalculator makes this easier because changing one input lets you watch connected results react. That supports sensitivity testing. Change one factor first. Observe the result. Restore it. Then test another. This simple habit reveals which variable is actually driving the scenario.
How Do Hash Rate and Hardware Efficiency Shape Mining Energy?
An engineer can know the network hash rate and still misunderstand electricity demand. Hash rate measures computational work. It is not an energy unit. Hardware efficiency connects that computational rate to electrical demand.
Imagine two mining fleets with the same hash rate. One uses older machines. The other uses newer equipment. Their network work may look identical. Their power demand can differ because the efficient fleet needs less energy for each unit of computation.
The difficult part is the fleet mix. A decentralized network does not operate one identical machine. Miners can use several hardware generations. Electricity prices differ. Cooling conditions differ. Some equipment becomes unprofitable sooner than other equipment. A single efficiency assumption therefore represents a scenario rather than every physical miner.
This is where scenario testing becomes useful. Start with a reasonable network condition. Then change the efficiency assumption. Watch how the energy result moves. Next, return the original value and change the network activity assumption. The comparison shows which factor creates greater sensitivity.
Power and energy also need separate mental models. Power describes the rate of electricity use. Energy accumulates that demand over time. A large mining installation can have a high power draw for a short period. Another can draw less power for much longer. Their final energy totals may still be comparable.
For buyers of mining equipment, efficiency specifications can therefore be useful without answering the complete environmental question. A low J/TH rating tells you something important about the machine. It does not tell you the carbon intensity of its electricity. It also does not predict how the entire network will respond.
For sustainability teams, the lesson is similar. Do not convert a hash-rate headline directly into an emissions claim. First establish the energy relationship. Then establish where that electricity is generated. Only after that should carbon enter the discussion.
AxiCalculator turns those connected concepts into an interactive workflow. It lets users explore technical variables without forcing every visitor to become a mining engineer. The goal is not to hide complexity. The goal is to reveal the part of complexity that changes the decision.
Why Can Mining Location Change Carbon Results More Than You Expect?
Two mining operations can use the same electricity and still report very different carbon results. The difference may have nothing to do with their machines. It can come from where their electricity is generated.
Electricity is an energy carrier. Its carbon intensity depends on the generation mix behind it. A grid dominated by lower-carbon generation can attach less operational CO2e to each kilowatt-hour. A carbon-heavy grid can attach more. The mining energy remains the same while the emissions layer changes.
This distinction is easy to miss because energy and carbon are often discussed as one idea. They are not. Energy tells you how much electricity the modeled mining activity uses. Carbon tells you the emissions associated with producing that electricity under the selected scenario.
Geography also introduces uncertainty. A cryptocurrency network may be distributed across countries and regions. Mining pools do not always identify every machine’s physical electricity source. A global factor may therefore be useful for a broad scenario, but it should not be mistaken for a site-specific measurement.
For a real mining facility, measured electricity and a defensible local electricity factor are much more useful. For a distributed network, a weighted regional estimate can provide better context. When location is uncertain, testing several plausible carbon factors is often more informative than displaying one overconfident value.
Cleaner electricity changes operational emissions. It does not automatically erase every environmental effect. Mining hardware still exists. Equipment still requires manufacturing and replacement. Facilities may require cooling and infrastructure. Those issues belong to broader environmental analysis and should not be silently folded into an electricity-only number.
This separation also improves business decisions. A team evaluating a low-carbon power contract should focus on the carbon layer. A team comparing mining hardware should focus first on energy efficiency. A team comparing two historical cryptocurrency scenarios may need both.
AxiCalculator helps keep those layers visible. You can test energy and carbon without pretending they are identical. That gives technical users a cleaner audit trail and gives nontechnical users a clearer explanation.
The best decision is rarely produced by the largest-looking number. It comes from understanding why that number moved.
How Can Cryptocurrency Mining and Metal Mining Be Compared Fairly?
A comparison becomes misleading when two industries are measured on different bases. Cryptocurrency mining and metal extraction produce very different outputs. One creates digital assets. The other produces physical materials. Comparing their raw energy totals alone does not answer a fair economic-intensity question.
A normalized economic basis provides one way to compare them. It asks how much energy is associated with producing the same amount of market value. This does not claim that one dollar of cryptocurrency and one dollar of copper serve the same purpose. It simply creates a common denominator for energy-intensity analysis.
The market price of both sides matters. Metal production may require a relatively stable physical energy input per kilogram. Yet its energy per dollar can change when the metal price changes. Cryptocurrency energy per dollar can move for the same denominator reason.
This is why a ratio should never be read without its basis. A ratio above one means the numerator is more intensive under the selected assumptions. A ratio below one reverses that relationship. The ratio does not prove that one industry is universally better.
The comparison becomes more useful when you change one assumption at a time. Keep the cryptocurrency scenario constant and change the metal. Then restore the metal and test another cryptocurrency condition. This separates the comparison choice from the mining-network choice.
For procurement teams, this kind of comparison can help explain scale. For students, it illustrates normalization. For sustainability analysts, it shows why economic intensity differs from absolute emissions. For engineers, it exposes how a denominator can influence a result without changing the underlying physical process.
The historical character of the data is especially important here. Mining networks evolve quickly. Hardware changes. Rewards change. Prices move sharply. Industrial metal data can also reflect different production routes and ore conditions. A comparison is therefore strongest when the two sides are clearly dated.
AxiCalculator treats the comparison as analytical context. It is not a moral ranking. The aim is to make the trade-off visible enough for the user to investigate further.
That difference matters for trust. A calculator should help users understand the result, not push them toward a predetermined opinion.
Energy per Coin, Energy per Dollar, and the Denominator Problem
A user can copy the correct number and still communicate the wrong result. The most common cause is losing the denominator. “Five kilowatt-hours” means something very different from “five kilowatt-hours per dollar.”
Energy per coin focuses on production of a cryptocurrency unit. It can help users understand how network power and issuance relate to newly mined coins. Energy per dollar normalizes that production by market value. It is more useful when comparing economic intensity across different assets or industries.
The two metrics can move in different directions. Suppose the physical mining burden per coin changes slowly while market price moves quickly. The per-dollar result can shift sharply. That movement does not necessarily reflect a sudden change in hardware.
This is why market-driven metrics deserve careful reading. They combine a physical numerator with an economic denominator. Both sides influence the displayed value.
Per-transaction metrics introduce a different denominator. They divide a network quantity across transaction activity. That can be useful for some allocation questions, but it should not be described as electricity physically caused by one transaction. Proof-of-work competition does not switch off between individual payments.
For business users, choosing the denominator starts with the decision. An operational mining team may care about measured electricity. A researcher may care about energy per coin. A cross-industry analyst may prefer energy per dollar. A network-level study may need the aggregate total.
There is no universal “best” denominator. There is only a denominator that fits the question better.
AxiCalculator keeps the economic and physical context close to the result. This reduces the chance that a copied number loses its meaning later. It also makes reverse analysis useful. A user can work from a desired output and explore what input would be required to reach it.
That is especially valuable when planning. Instead of asking only what the footprint is, you can ask what would need to change. The second question often leads to a better decision.
How Can AxiCalculator Help You Test Better Cryptocurrency Mining Scenarios?
The hardest real-world problem is usually not obtaining one result. It is deciding whether that result remains useful when conditions change. Cryptocurrency mining combines technical, economic, and environmental variables. A fixed headline cannot show those interactions.
AxiCalculator gives you a workspace for testing them. Start with the scenario that best matches your question. Change the cryptocurrency context. Test a different price. Compare another metal. Change the electricity context when carbon matters. Watch which output moves.
The fastest workflow is simple. Change one variable at a time. Record the direction of change. Restore the baseline. Then test the next variable. This avoids confusing several causes at once.
Reverse solving adds another layer. Sometimes you know the result you want to investigate. You may want to know what exchange price would correspond to a target energy intensity. You may want to see what electricity condition would match a selected carbon result. Bidirectional calculation turns the tool from a result generator into a scenario explorer.
That matters for technical review. A forward calculation answers, “What happens with these inputs?” Reverse solving answers, “What input would be required for this output?” Together, they expose relationships that are harder to see in a static article.
The tool also supports different user levels. A first-time visitor can focus on the visible result. A technical user can examine the scenario more deeply. An analyst can compare states. A reviewer can reproduce the same inputs.
For professional decisions, the final result should still be reviewed in context. Mining markets can move quickly. Network conditions can change. Electricity supply can change. A model is strongest when it helps you identify the assumption that deserves verification.
AxiCalculator is built around that idea. It does not need to overwhelm the user with technical language. The calculator can carry the computational complexity while the page explains the decision in simple terms.
Use the calculator when you need a fast scenario. Use deeper technical review when the result affects formal reporting, investment, engineering, or environmental decisions. AxiCalculator also provides a path to technical consultation when a calculation needs professional validation.
The most useful result is not the one with the most decimal places. It is the one you can understand, challenge, reproduce, and act on.
Frequently Asked Questions
Why can my crypto footprint rise even when I make fewer transactions?
Can renewable-powered mining make a cryptocurrency footprint zero?
What does a footprint ratio above one mean in plain English?
Why can two cryptocurrency footprint calculators show different results for the same coin?
How should an ESG analyst document a cryptocurrency footprint result for review?
What should an engineer do when the physical location of miners is incomplete?
When should a historical cryptocurrency mining footprint scenario be recalculated?
Our engineers are here to help you get it right.