Plastic Footprint Calculator
- Last formula update:
Decimal & Rounding Policy
- Decimal quantities are accepted for plastic usage, and zero is a valid value.
- Intermediate calculations retain full precision and are never rounded between calculation steps.
- Annualization uses 365.25 days per year with precise rate-conversion factors.
- Editable values may display up to 15 decimal places with unnecessary trailing zeros removed.
- Plastic footprint results are rounded only for display without changing stored calculation values.
- Unit changes preserve the underlying physical quantity and prevent cumulative rounding drift.
Valid range
- Item quantities may range from 0 to 1,000,000,000 per selected usage period.
- Decimal item quantities are valid, while negative and non-finite values are rejected.
- Other plastic mass may range from 0 to 1,000,000,000 kg/year after unit normalization.
- Annual plastic footprint results may range from 0 to 1,000,000,000 kg/year.
- Lifetime plastic footprint results may range from 0 to 75,000,000,000 kg.
- Reverse-solved quantities must remain non-negative and within the corresponding source-field range.
- Supported usage periods are per day, week, month, three months, half-year, and year.

Tivessa Zorquell
Reviewers:
Veralisse Noxmere
Sarven Kestthorne
Check our editorial policy
September 13, 2026
1.0.0
Initial calculator and formula release.
Our engineers are here to help you get it right.
How Can a Plastic Footprint Calculator Reveal Your Annual Plastic Use?
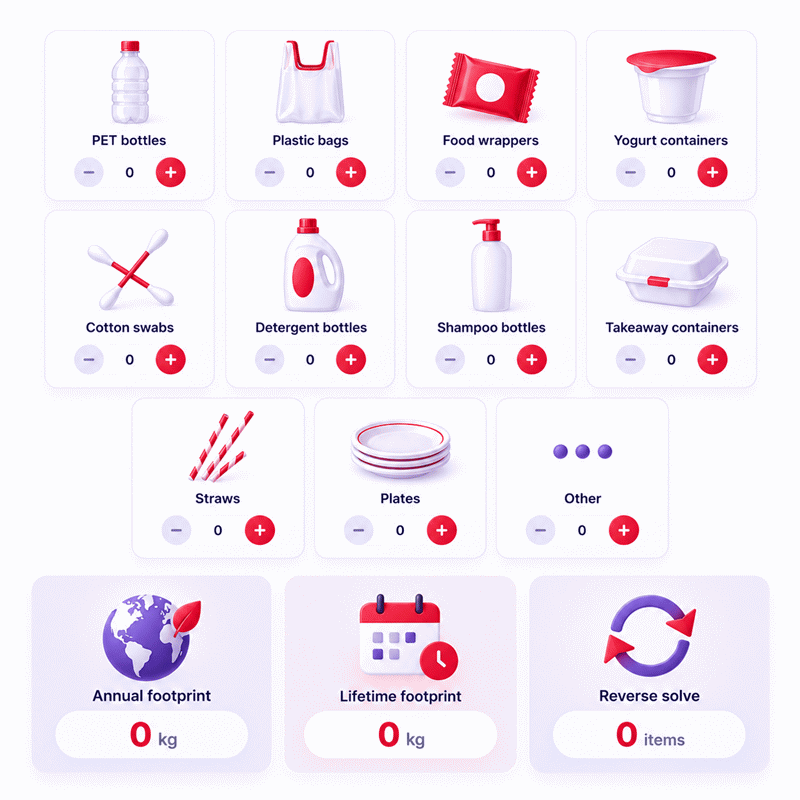
Plastic Footprint Calculator results turn everyday product habits into an estimated annual plastic mass. Enter how often you use common items such as PET bottles, plastic bags, food wrappers, yogurt containers, personal-care packaging, cleaning bottles, takeaway containers, cups, straws, cutlery, and plates. The calculator normalizes different usage periods so the categories can be compared on the same annual basis.
- Track only the plastic categories that apply to your routine.
- Use daily, weekly, monthly, quarterly, half-yearly, or yearly frequencies.
- See the estimated annual plastic mass update as your entries change.
- Compare habits instead of relying on a vague sustainability score.
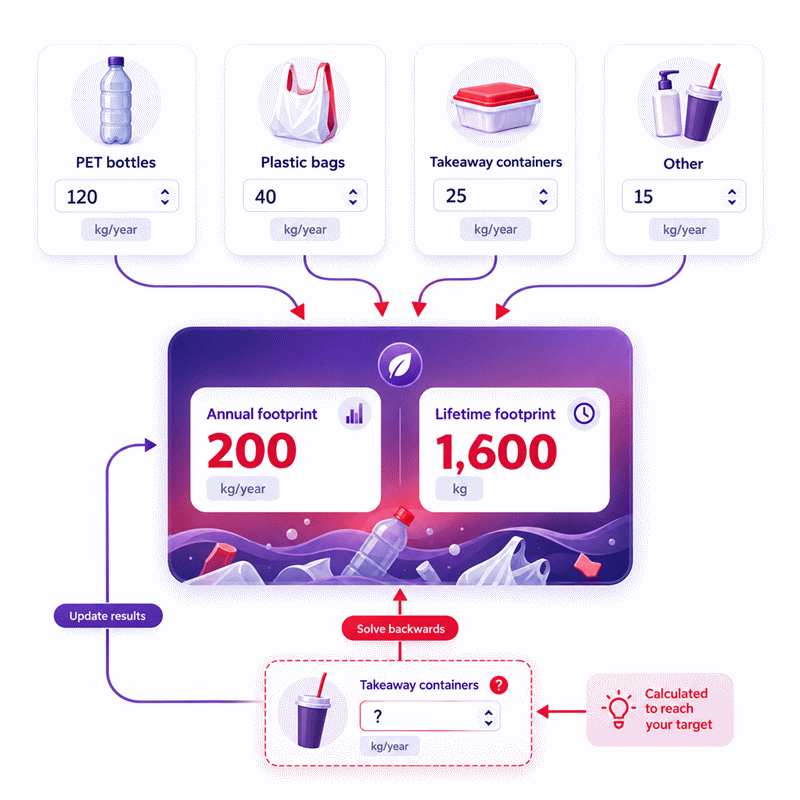
- Use editable results to solve one unknown source from a target footprint.
- Test reusable alternatives by lowering the relevant consumption frequency.
- Use measured product data when professional accuracy is required.
The Plastic Footprint Calculator is most useful as a consistent baseline. Recalculate after a meaningful lifestyle change and compare results using the same measurement boundary. This helps identify which repeated habits create the largest controllable share of your recorded plastic use.
Assumptions used in this calculator
- Each listed product uses a representative fixed plastic mass per item.
- Usage frequency is assumed constant across the selected annualization period.
- A year is modeled as 365.25 days for rate conversion.
- Weekly rates use 365.25 divided by seven weeks per year.
- Monthly, quarterly, half-year, and yearly rates use fixed annual factors.
- Other plastic is entered directly as an annual mass rate.
- Lifetime footprint assumes the current annual pattern continues for 75 years.
- Zero consumption is valid and contributes zero plastic mass.
- Decimal quantities are allowed for partial or averaged consumption.
- Product weights may differ by brand, size, material, and region.
- Recycling, reuse, leakage, and disposal pathways are not separately modeled.
- Results estimate plastic mass, not carbon emissions or environmental damage.
- Industrial users should replace assumptions with measured product-specific data when available.
Results are rounded for display.
Internal calculations use full precision.
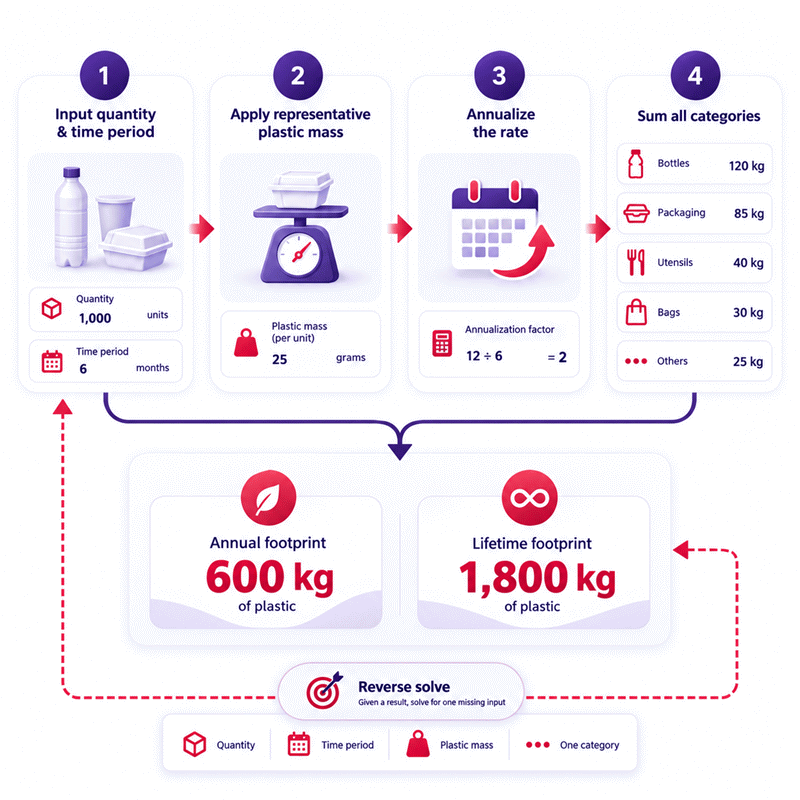
Formulas Used in Plastic Footprint Calculator :
1. Usage Rate Annualization Factor
2. Annual Plastic Mass for a Count-Based Item
3. Direct Annual Mass Unit Normalization
4. Total Annual Plastic Footprint
5. Lifetime Plastic Footprint
6. Annual Target from an Editable Lifetime Result
7. Reverse Solution for One Unknown Count-Based Item
- i
- Index of a count-based plastic item from 1 through 15.
- j
- Index of the single count-based item selected as the reverse-solved unknown.
- pi
- Selected usage period for item i.
- f(pi)
- Annualization factor corresponding to the selected usage period.
- qi
- Displayed quantity of item i per selected usage period.
- wi
- Representative plastic mass assigned to item i, measured in grams per item.
- Ci
- Annual plastic mass contribution of item i, measured in kilograms per year.
- xu
- Displayed direct annual mass entered using mass unit u.
- cu
- Conversion factor from one selected mass unit to kilograms.
- O
- Normalized annual mass for the Other category, measured in kilograms per year.
- T
- Total annual plastic footprint, measured in kilograms per year.
- Y
- Lifetime projection period, fixed at 75 years.
- L
- Projected lifetime plastic footprint, measured in kilograms.
- T*
- Annual target mass used during reverse solving.
- L*
- Editable lifetime target mass used during reverse solving.
Variables & Definitions
View a complete list of all variables used in this calculator, including definitions and units
Plastic Footprint Calculator Variables and Calculation Parameters
| Variable | Meaning | Unit or Value | Calculation Role |
|---|---|---|---|
| i | Count-based plastic item index | 1 to 15 | Identifies each listed plastic product |
| j | Unknown item index | 1 to 15 | Identifies the single source solved during reverse calculation |
| pi | Selected usage period | day, week, month, 3 months, half-year, year | Selects the correct annualization factor |
| f(pi) | Annualization factor | 365.25, 365.25/7, 12, 4, 2, or 1 | Converts the selected usage frequency to an annual rate |
| qi | Quantity of plastic item i | items per selected period | Primary count-based user input |
| wi | Representative plastic mass of item i | g/item | Converts item count into plastic mass |
| Ci | Annual contribution of item i | kg/year | Annual plastic mass generated by one count-based category |
| xu | Displayed direct annual mass | selected mass unit/year | User-entered value for the Other category |
| cu | Mass conversion factor | kg per selected unit | Normalizes mass values to kilograms |
| O | Other annual plastic mass | kg/year | Adds directly to the annual footprint |
| T | Total annual plastic footprint | kg/year | Sum of all annual plastic contributions |
| Y | Lifetime projection period | 75 years | Scales annual plastic use to a lifetime estimate |
| L | Lifetime plastic footprint | kg | Projected plastic mass over the lifetime period |
| T* | Reverse annual target | kg/year | Target annual footprint used to solve one unknown source |
| L* | Reverse lifetime target | kg | Editable lifetime result converted into an annual reverse target |
Unit Conversion Table
Usage Rate Conversion Table
| Unit Group | Unit Name | Symbol | Equivalent in Per Year | Used For |
|---|---|---|---|---|
| Popular Units | Per Day | /day | 365.25/year | Count-based plastic items |
| Popular Units | Per Week | /week | 52.1785714286/year | Count-based plastic items |
| Popular Units | Per Month | /month | 12/year | Count-based plastic items |
| Popular Units | Per Three Months | /3 months | 4/year | Count-based plastic items |
| Popular Units | Per Half-Year | /half-year | 2/year | Count-based plastic items |
| Popular Units | Per Year | /year | 1/year | Count-based plastic items |
Annual Plastic Mass Conversion Table
| Unit Group | Unit Name | Symbol | Equivalent in kg/year | Used For |
|---|---|---|---|---|
| Popular Units | Kilogram per Year | kg/year | 1 kg/year | Annual total and Other annual mass |
| Popular Units | Pound per Year | lb/year | 0.45359237 kg/year | Annual total and Other annual mass |
| Popular Units | Ounce per Year | oz/year | 0.028349523125 kg/year | Annual total and Other annual mass |
| Scientific Units | Gram per Year | g/year | 0.001 kg/year | Small annual plastic masses |
| Scientific Units | Metric Tonne per Year | t/year | 1000 kg/year | Large annual plastic masses |
Lifetime Plastic Mass Conversion Table
| Unit Group | Unit Name | Symbol | Equivalent in kg | Used For |
|---|---|---|---|---|
| Popular Units | Kilogram | kg | 1 kg | Lifetime plastic footprint |
| Popular Units | Pound | lb | 0.45359237 kg | Lifetime plastic footprint |
| Popular Units | Ounce | oz | 0.028349523125 kg | Lifetime plastic footprint |
| Scientific Units | Gram | g | 0.001 kg | Small lifetime plastic masses |
| Scientific Units | Metric Tonne | t | 1000 kg | Large lifetime plastic masses |
Example Calculation
Lifetime plastic footprint: 535.1464285714 kg
The weekly bottle quantity is first converted into an annual item count.
The annual bottle count is multiplied by the representative plastic mass per bottle.
The direct Other mass is added after normalization to kilograms per year.
The lifetime estimate applies the same annual footprint across the 75-year projection.
Annual plastic footprint: 8 kg/year
Lifetime plastic footprint: 600 kg
The editable lifetime result is first converted back to its annual target.
Known annual plastic contributions are subtracted before solving the unknown source.
The remaining annual plastic mass is converted into the required weekly bottle quantity.
The solved quantity reproduces the requested lifetime footprint when recalculated forward.
Results are rounded for display.
Internal calculations use full precision.
Calculations Disclaimer
This Plastic Footprint Calculator provides estimated results for informational and educational purposes. Calculations are based on user-entered consumption frequencies, representative fixed plastic masses for listed products, annualization factors, and a 75-year lifetime projection. Actual plastic consumption may differ because product size, material composition, packaging design, reuse, recycling, disposal practices, and personal habits vary. The results represent estimated plastic mass and do not constitute a complete life-cycle assessment, environmental impact assessment, regulatory determination, or professional engineering analysis. Industrial, commercial, sustainability-reporting, procurement, compliance, and audit applications should verify results using measured product-specific data and applicable standards before making decisions.
How Much Plastic Do You Actually Use in a Year?
A plastic bottle can disappear from your desk in minutes. A shopping bag may leave your home the same day. That makes plastic consumption easy to underestimate. The Plastic Footprint Calculator turns those repeated habits into one annual mass estimate. Instead of asking you to guess a yearly number, it begins with products you can recognize from daily life.
The tool covers common food and kitchen items, bathroom products, cleaning containers, takeaway packaging, disposable tableware, and additional plastic that does not fit a standard category. You can enter only the products you use. A category with no consumption can remain at zero, so the calculation does not force an artificial lifestyle profile.
This approach is useful because frequency changes perspective. One light item may appear insignificant in your hand. Repeating the same purchase every day or every week can make it important over a full year. A heavier container purchased only a few times may contribute less than expected. The calculator helps reveal that difference without requiring you to weigh every item yourself.
Why Small Plastic Habits Become Large Annual Totals
A common problem is focusing only on the size of one product. The better question is how often that product enters your routine. Bottles, wrappers, bags, takeaway cups, and disposable cutlery are often purchased or accepted repeatedly. Their individual mass may look small, yet repetition creates accumulation.
That is why the calculator asks for both quantity and usage period. Someone may know that three bottles are used each week but have no idea what that means over a year. Another person may replace a toothbrush several times per year but use food wrappers every day. Converting each habit to the same yearly basis makes those patterns comparable.
The result is especially useful as a personal baseline. It does not tell you that every gram causes identical environmental harm. It tells you which recorded habits account for your estimated plastic mass. That narrower interpretation keeps the number practical and prevents a simple consumption estimate from being confused with a complete environmental assessment.
What Your Plastic Footprint Result Really Measures
A frequent mistake is treating every environmental metric as interchangeable. Plastic consumption, plastic waste, recycling, litter, ocean leakage, and greenhouse-gas emissions describe different things. The result on this page focuses on the estimated mass of selected plastic products associated with your entered consumption pattern.
This distinction matters. A bottle placed in a recycling bin was still acquired and used. A container that reaches landfill has a different end-of-life pathway, but it was also part of consumption. The calculator therefore gives you a clean starting point: the amount of plastic represented by the habits you entered.
Once you understand that boundary, the result becomes more useful. You can use it to compare your own behavior over time. You can test a lower bottle frequency. You can reduce takeaway containers. You can examine the effect of fewer cleaning-product bottles. The number becomes a measurement tool rather than a vague environmental score.
How to Use the Plastic Footprint Calculator
The most common problem is trying to remember an entire year of consumption at once. Do not start there. Think about a normal recent period. Look at the products you use during a typical day, week, month, or longer replacement cycle. Enter the quantity in the period that feels easiest to estimate.
You do not need to complete every field. Start with the categories you understand well. The calculator updates as valid values are entered, so you can see the result develop progressively. This makes it easier to identify which entries deserve a closer check.
Start With Food and Kitchen Plastic
Food and drink habits are usually easy to remember because they repeat often. Count PET bottles used for beverages or similar products. Estimate plastic shopping or produce bags. Include food wrappers and yogurt containers when they are part of your normal routine.
Use a representative period rather than an unusually busy holiday or travel week. If your consumption changes substantially between weekdays and weekends, estimate a normal average. The goal is not to create perfect diary data. The goal is to create a realistic baseline that can be improved later.
Add Bathroom and Laundry Packaging
Bathroom products can be harder to estimate because they are replaced less often. Think about cotton swabs, detergent and cleaning-product bottles, shampoo or cosmetic bottles, refill packets, toothbrushes, and toothpaste tubes. For these products, a monthly, half-yearly, or yearly estimate may be easier than a weekly one.
Do not increase the quantity simply because a bottle is large. The calculator already distinguishes product categories through its model. Your task is to estimate how many units enter your routine during the selected period.
Include Takeaway Containers and Disposable Items
Takeaway habits can change quickly. One office routine may create several containers, cups, straws, pieces of cutlery, or plates each week. A home-cooking routine may create almost none. Enter your own behavior rather than what you think an average person uses.
This category is useful for scenario testing. If takeaway packaging forms a noticeable part of your result, reduce the relevant entries to represent a reusable-container habit or fewer takeaway meals. The change in the annual result shows the scale of that specific decision.
Capture Plastic That Does Not Fit the Main Categories
No short form can list every plastic product. The additional plastic field exists for mass that you want to include but cannot reasonably express through the listed product counts. This can help prevent the main categories from becoming an endless catalogue.
Use this field carefully. If you have direct annual mass data, enter it consistently. Do not add an item here when you have already counted it in another category. Avoiding double counting is more valuable than trying to make the total look comprehensive.
Which Everyday Habits Increase Plastic Use the Fastest?
People often expect the most visible plastic object to dominate their result. That is not always what happens. The combination of item mass and repeated frequency controls the contribution. A product used often can become important even when each unit is light.
Frequent Bottled Drinks and Plastic Bags
Bottled drinks are easy to overlook because each purchase feels temporary. If you use them repeatedly, test the effect of changing only that input. The difference gives you a direct estimate of how a refillable bottle could change the recorded annual mass.
Plastic bags work the same way. A single light bag contributes little, but a high recurring count can change the annual result. Reusing existing bags and declining unnecessary new ones can reduce the frequency entered in the calculator without requiring a complicated lifestyle change.
Food Wrappers, Yogurt Containers, and Takeaway Packaging
Food packaging often arrives in many small pieces. Users can underestimate it because each item enters the home separately. Track the items you can count consistently instead of trying to remember every piece of film or hidden packaging.
Takeaway boxes and cups deserve the same treatment. If a workplace routine creates several units each week, testing a reusable lunch container or cup can produce a clear before-and-after comparison. That comparison is often more useful than a generic sustainability target.
Cleaning and Personal-Care Containers
Cleaning and personal-care packaging creates a different challenge. These products may be heavier but purchased less frequently. That makes memory less reliable. Check purchase history, storage cupboards, or replacement intervals when you want a better estimate.
Refill systems may change how many rigid bottles you purchase. Concentrated products may also alter packaging frequency. Rather than assuming that a product is automatically better, update the calculator with your actual purchasing pattern and compare the annual result.
How Should You Interpret Your Annual Plastic Footprint?
A number without context can create false confidence. Your annual result should be read as an estimate based on the product categories and consumption rates you entered. It is most valuable when you compare it with another result produced using the same measurement approach.
Separate Plastic Consumption From Recycling Outcomes
Recycling is an end-of-use question. Consumption is an acquisition and use question. Mixing the two can hide what you are trying to measure. If you purchased and used a plastic product, it remains part of the consumption baseline even when you later sort it for recycling.
This does not make recycling irrelevant. It simply keeps two decisions separate. First measure what enters your routine. Then consider what happens after use. This separation makes changes easier to diagnose because a reduction in purchased plastic cannot be confused with a change in disposal behavior.
Understand What a Lifetime Projection Can and Cannot Tell You
A long-term projection can make repeated habits easier to visualize. It should not be read as a prediction of your actual future. People move, change diets, switch products, adopt reusable systems, and alter shopping patterns. The projection is a continuation of the current annual pattern, not a forecast of personal behavior.
Use it as a perspective tool. If a small weekly habit creates a surprisingly large long-term quantity, that can help you identify a meaningful reduction opportunity today.
How Can You Reduce Plastic Without Guesswork?
The easiest mistake is trying to change everything at once. A better strategy is to identify the largest controllable category in your result. Focus on one habit, change it, and calculate again.
Target High-Frequency Disposable Products First
High-frequency products provide repeated opportunities for reduction. A reusable bottle, shopping bag, cup, or food container can influence many future transactions. The calculator makes this visible because lowering frequency immediately changes the annual result.
Choose a change you can maintain. A dramatic one-week effort followed by a return to the old routine does not create a reliable new baseline. A smaller change that becomes normal can be more useful.
Replace Repeated Purchases With Durable Reusable Options
Reuse works best when it actually prevents a new disposable item from entering your routine. Owning several reusable products without using them does not change your consumption pattern. The practical goal is substitution: one durable item replacing repeated acquisitions.
When a reusable option becomes part of your routine, update the corresponding frequency. The result gives you a simple way to quantify the difference between the old and new patterns.
Use Your Result as a Personal Reduction Baseline
Your first result is not a score you need to defend. Treat it as a starting measurement. Save the result, make one realistic change, and calculate again after the new behavior has stabilized.
This approach creates a feedback loop. You can see which actions produce meaningful changes and which have little effect within the measured categories. That makes future decisions more focused.
Why Can Two People With Similar Lifestyles Get Different Results?
Two users may both say they “use a lot of plastic” yet generate different calculator results. Consumption frequency, product mix, package size, and replacement intervals can all differ. Broad lifestyle labels are therefore less useful than actual entries.
Product Size and Packaging Design Change Plastic Mass
Real plastic products are not manufactured at one universal mass. A bottle can use different wall thickness, capacity, cap design, labels, and resin combinations. Bags and wrappers can vary even more. Representative product masses are useful for screening, but direct measurements can improve professional work.
Frequency Matters as Much as the Weight of One Item
A heavier product used once a year may contribute less than a lighter product used every day. That is why changing a usage period must preserve the physical rate rather than simply keeping the same visible number. The calculator is designed around the underlying consumption pattern.
How Can Professionals Improve Plastic Footprint Data Quality?
An industrial user faces a different problem from a household user: decisions may require traceable evidence. Default estimates are useful for early screening, but procurement, reporting, design, and compliance work should move toward product-specific data.
Replace Generic Estimates With Measured Packaging Data
When higher accuracy matters, weigh clean and empty packaging with suitable equipment. Record which components are included. A bottle, closure, label, pump, and protective film may need separate treatment when the project boundary requires it.
Repeat measurements when packaging varies. A single sample may not represent every supplier batch or product size. Record the measurement date and method so another reviewer can understand the basis of the number.
Use Supplier Specifications When Direct Weighing Is Impractical
Packaging suppliers often maintain technical specifications that include component mass or material information. Those records can be more useful than generic internet averages when the exact purchased component is known. Keep the source document with the calculation record.
Document the Measurement Boundary Before Comparing Results
A comparison becomes misleading when one dataset includes caps and labels while another includes only the bottle body. Define the boundary first. Apply the same boundary to both scenarios. This simple discipline often improves comparison quality more than adding extra decimal places.
When Should You Recalculate Your Plastic Footprint?
A footprint becomes less useful when your habits have changed but the inputs have not. Recalculate after meaningful changes in bottled drinks, shopping bags, takeaway meals, personal-care products, cleaning systems, or household routines.
Recheck After Meaningful Changes in Consumption Habits
You do not need to update the calculation after every purchase. Wait until a new behavior represents your normal routine. Then enter the new frequency and compare it with your earlier baseline.
Compare Consistent Measurement Periods Instead of Isolated Weeks
A holiday, move, illness, event, or busy work period can distort short-term consumption. When possible, use a normal period or average several periods. Consistency makes your before-and-after comparison more meaningful.
What Should You Do After Seeing Your Result?
The useful question is not whether the number feels high or low. Ask which category you can realistically change. Identify the largest repeated source that is under your control, test a lower frequency, and see how the annual result responds.
Turn the Largest Plastic Category Into Your First Reduction Target
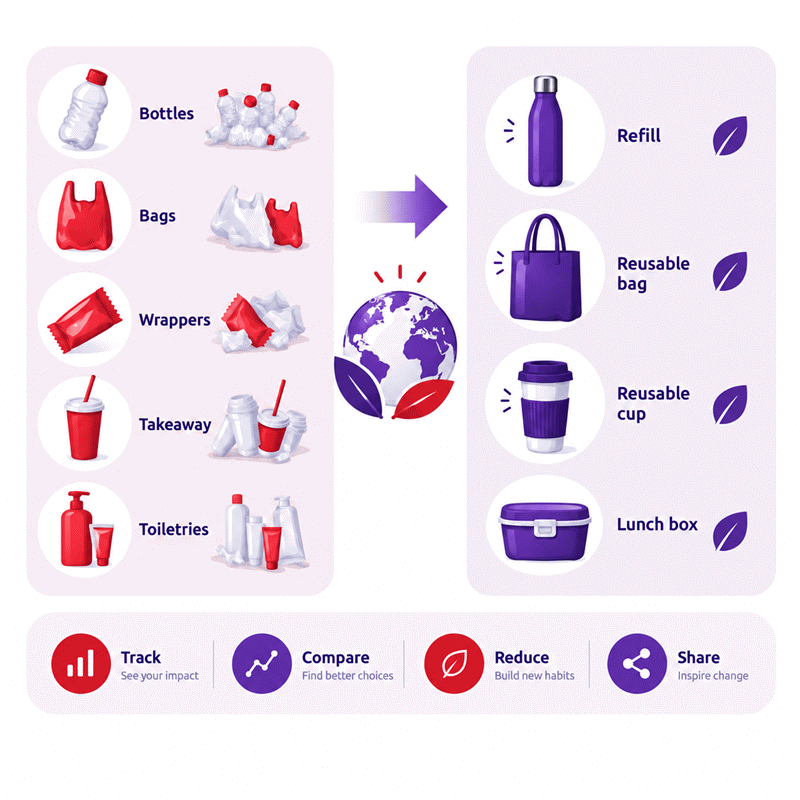
Start with one measurable action. Carry a refillable bottle. Reuse shopping bags. Bring a cup. Reduce takeaway packaging. Choose a refill system that actually replaces a rigid container. Then return to AxiCalculator and measure the new pattern.
The Plastic Footprint Calculator works best as a decision tool, not a judgment. A clear baseline, one practical change, and a consistent follow-up measurement can tell you more than a vague promise to “use less plastic.”
Frequently Asked Questions
Can I use the calculator if I only know a few of my plastic habits?
Why can my result change when my lifestyle seems almost unchanged?
Should recycled plastic products still be included in my inputs?
How can I use the result to reduce plastic without changing everything at once?
How should an engineer improve the calculator data for a corporate packaging study?
Why is it mathematically invalid to reverse-solve two unknown plastic inputs from one total?
When is a personal plastic footprint estimate unsuitable for professional reporting?
Our engineers are here to help you get it right.