Vegan Footprint Calculator
- Last formula update:

Decimal & Rounding Policy
- Calculations use full precision and never round intermediate values.
- Fractional vegan durations remain valid and produce proportional footprint estimates.
- Reverse calculations use unrounded base values before converting selected units.
- Displayed results use thousands separators and up to 12 significant digits.
- Whole-number results display without unnecessary trailing decimal zeros.
Valid range
- Time: 0 to 1,000,000,000 equivalent days, including fractional values.
- Animal lives: 0 to 1,000,000,000 estimated lives.
- CO2: 0 to 20,000,000,000 lb base equivalent.
- Forests: 0 to 30,000,000,000 ft² base equivalent.
- Grain: 0 to 40,000,000,000 lb base equivalent.
- Water: 0 to 1,100,000,000,000 US gal base equivalent.
- All inputs must be finite, non-negative numeric values within supported limits.
- Unit changes preserve physical quantity and do not change base limits.

Tivessa Zorquell
Reviewers:
Veralisse Noxmere
Sarven Kestthorne
Check our editorial policy
September 12, 2026
1.0.0
Initial calculator and formula release.
Our engineers are here to help you get it right.
What Can a Vegan Footprint Calculator Tell You at a Glance?
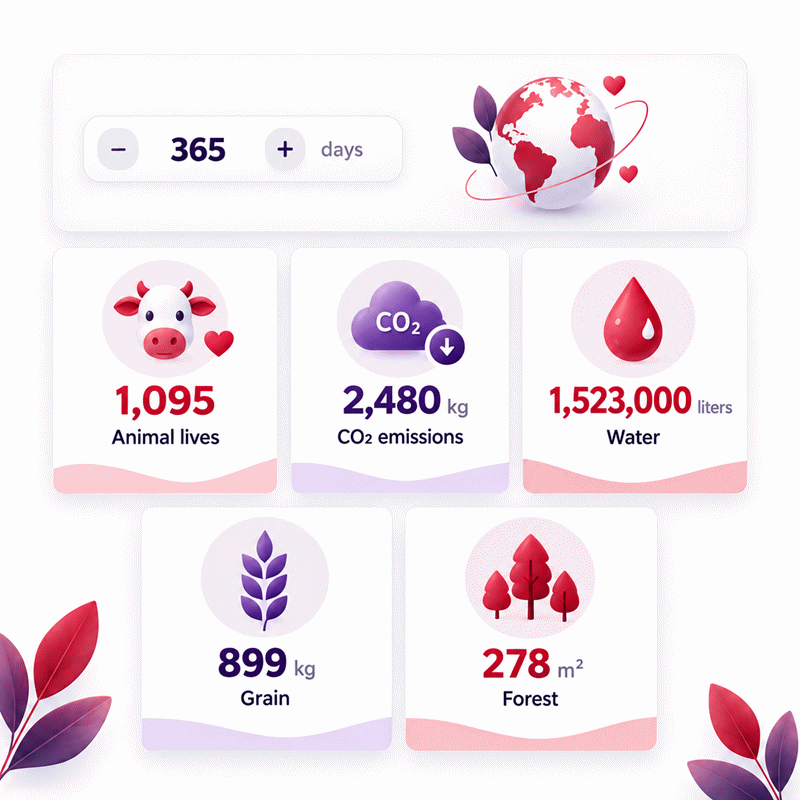
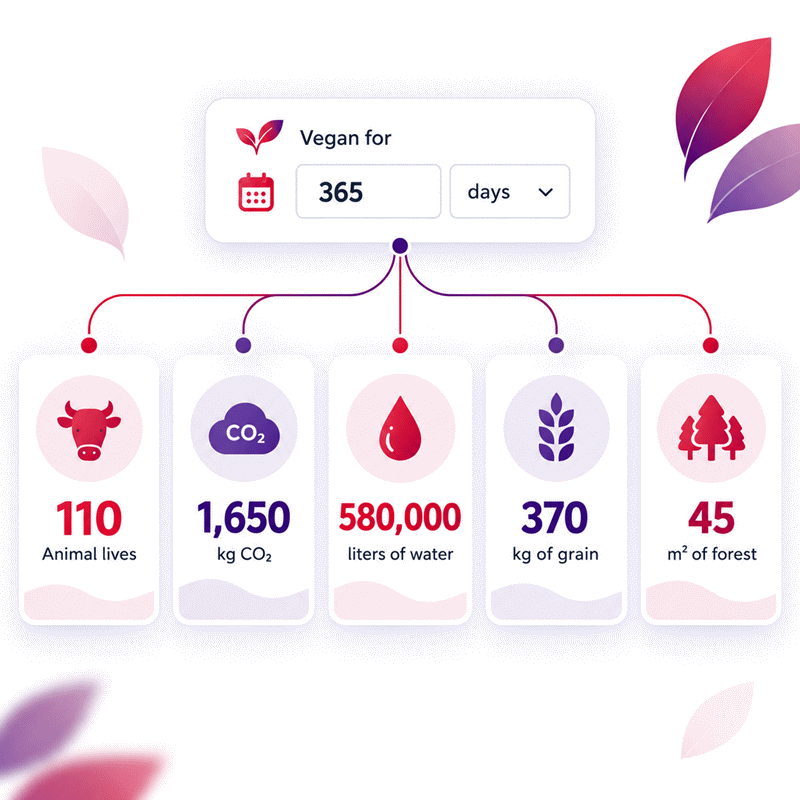
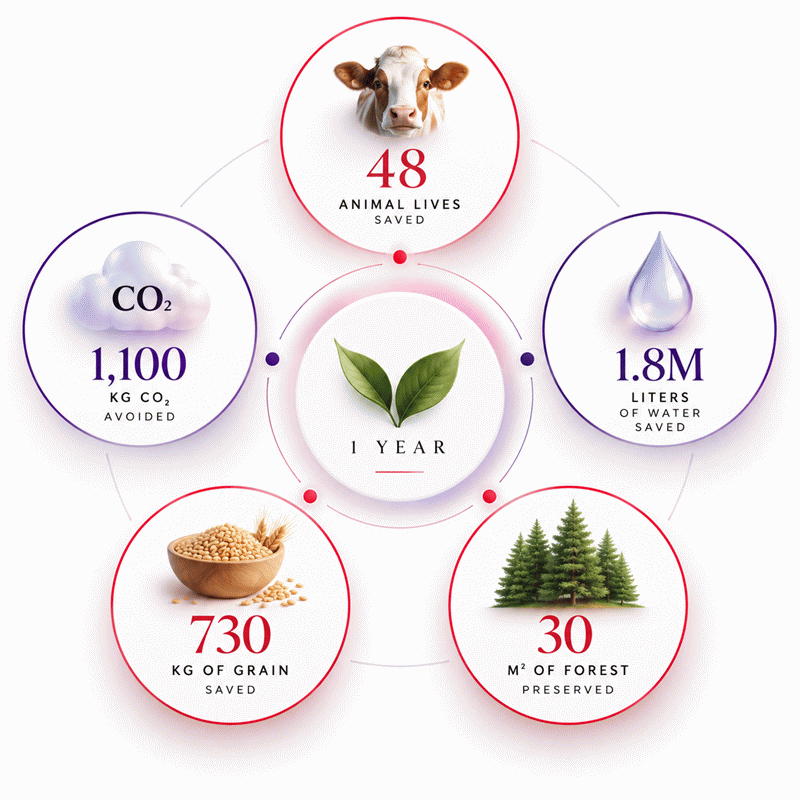
Vegan Footprint Calculator results turn your vegan duration into five clear estimates: animal lives, water, grain, forest area, and CO2. The tool is designed to make cumulative impact easier to explore without combining unlike environmental quantities into one artificial score.
- Enter a vegan duration and view all connected estimates instantly.
- Start from an editable result when you want to solve backward.
- Review animal, water, grain, forest, and carbon outputs separately.
- Use the tool for personal tracking, education, and scenario exploration.
- Share or export a result when you need a reproducible record.
- Interpret the totals as modeled estimates rather than personal measurements.
The Vegan Footprint Calculator is especially useful when a date or environmental number feels too abstract on its own. It creates a consistent way to explore how a vegan timeline relates to several resource indicators, while keeping the results clear enough for everyday users and structured enough for students, educators, sustainability communicators, and technical readers.
Assumptions used in this calculator
- One vegan day is the calculator’s base time interval.
- Each vegan day represents one estimated animal life saved.
- Each vegan day represents 1,100 US gallons of water saved.
- Each vegan day represents 40 pounds of grain saved.
- Each vegan day represents 30 square feet of forest saved.
- Each vegan day represents 20 pounds of CO2 emissions saved.
- Savings scale linearly with the equivalent number of vegan days.
- Fractional days produce proportional fractional estimates across all outputs.
- Zero days produces zero estimated savings for every result.
- Unit conversions preserve the same underlying physical quantity.
- Intermediate calculations use full precision without premature rounding.
- Reverse solving assumes the same fixed daily factors as forward calculation.
- Actual environmental outcomes may vary with location, diet, and supply chains.
Results are rounded for display.
Internal calculations use full precision.
Formulas Used in Vegan Footprint Calculator :
- t
- Entered vegan duration in the selected time unit.
- kt
- Number of days represented by one selected time unit.
- D
- Equivalent vegan duration in days.
- A
- Estimated animal lives saved.
- C
- Estimated CO2 saved in pounds.
- F
- Estimated forest area saved in square feet.
- G
- Estimated grain saved in pounds.
- W
- Estimated water saved in US gallons.
- q
- A displayed result value expressed in its selected unit.
- Qb
- The same result normalized to its calculator base unit.
- kq
- Base-unit quantity represented by one selected result unit.
- rQ
- Applicable daily rate: 1, 20, 30, 40, or 1,100 base units per day.
Equivalent Duration in Days
Animal Lives Saved
CO2 Saved
Forest Area Saved
Grain Saved
Water Saved
Unit Normalization
Reverse Calculation
Variables & Definitions
View a complete list of all variables used in this calculator, including definitions and units
Vegan Footprint Calculator Variables and Calculation Parameters
| Variable | Symbol | Meaning | Base Unit | Calculation Role |
|---|---|---|---|---|
| Entered duration | t | User-entered vegan duration. | Selected time unit | Primary forward-calculation input. |
| Time conversion factor | kt | Days represented by one selected time unit. | days per unit | Converts entered time into equivalent days. |
| Equivalent duration | D | Canonical duration used by every footprint equation. | d | Central calculation value. |
| Animal lives saved | A | Estimated animal lives associated with the duration. | count | 1 life per day. |
| CO2 saved | C | Estimated carbon dioxide emissions saved. | lb | 20 lb per day. |
| Forest area saved | F | Estimated forest area associated with the duration. | ft² | 30 ft² per day. |
| Grain saved | G | Estimated grain associated with the duration. | lb | 40 lb per day. |
| Water saved | W | Estimated water associated with the duration. | US gal | 1,100 US gal per day. |
| Displayed result value | q | A result expressed in its currently selected unit. | Selected result unit | Used for display and reverse input. |
| Base result quantity | Qb | A result normalized to its calculator base unit. | Dimension-specific base unit | Used before reverse solving. |
| Result conversion factor | kq | Base units represented by one selected result unit. | base units per unit | Preserves physical quantity during unit conversion. |
| Daily result rate | rQ | Fixed daily rate for the selected footprint result. | base units per day | Used to recover equivalent days in reverse calculations. |
Unit Conversion Table
Time Unit Conversion Table
| Unit Group | Unit Name | Symbol | Equivalent in Days | Used For |
|---|---|---|---|---|
| Popular Units | Day | d | 1 | Vegan duration |
| Popular Units | Week | wk | 7 | Vegan duration |
| Popular Units | Average Month | mo | 30.4375 | Vegan duration |
| Popular Units | Average Year | yr | 365.25 | Vegan duration |
| Popular Units | Hour | h | 0.0416666666667 | Vegan duration |
| Scientific Units | Minute | min | 0.000694444444444 | Vegan duration |
| Scientific Units | Second | s | 0.0000115740740741 | Vegan duration |
Mass Unit Conversion Table
| Unit Group | Unit Name | Symbol | Equivalent in Pounds | Used For |
|---|---|---|---|---|
| Popular Units | Pound | lb | 1 | CO2 and grain |
| Popular Units | Kilogram | kg | 2.2046226218487757 | CO2 and grain |
| Scientific Units | Gram | g | 0.0022046226218487757 | CO2 and grain |
| Scientific Units | Metric Tonne | t | 2,204.6226218487757 | CO2 and grain |
| Scientific Units | US Short Ton | US ton | 2,000 | CO2 and grain |
Area Unit Conversion Table
| Unit Group | Unit Name | Symbol | Equivalent in Square Feet | Used For |
|---|---|---|---|---|
| Popular Units | Square Foot | ft² | 1 | Forest area |
| Popular Units | Square Meter | m² | 10.763910416709722 | Forest area |
| Popular Units | Acre | acre | 43,560 | Forest area |
| Popular Units | Hectare | ha | 107,639.10416709722 | Forest area |
| Scientific Units | Square Kilometer | km² | 10,763,910.416709721 | Forest area |
Volume Unit Conversion Table
| Unit Group | Unit Name | Symbol | Equivalent in US Gallons | Used For |
|---|---|---|---|---|
| Popular Units | US Gallon | US gal | 1 | Water |
| Popular Units | Liter | L | 0.2641720523581484 | Water |
| Popular Units | Imperial Gallon | Imp gal | 1.2009499255048557 | Water |
| Scientific Units | Cubic Meter | m³ | 264.1720523581484 | Water |
| Scientific Units | Acre-Foot | acre-ft | 325,851.4285714286 | Water |
Example Calculation
The entered duration is first represented as 42 equivalent vegan days.
Each result uses its fixed daily saving factor without intermediate rounding.
The same physical results can then be displayed in other compatible units.
Changing a display unit converts the value without changing the underlying footprint.
66,000 ÷ 1,100 = 60 days
The known water result is first normalized to its base volume unit.
Dividing by the daily water factor recovers 60 equivalent vegan days.
The recovered duration becomes the common basis for every remaining result.
Reverse solving therefore reproduces the same footprint as a forward calculation.
Results are rounded for display.
Internal calculations use full precision.
Calculations Disclaimer
What Does a Vegan Footprint Calculator Reveal That a Date Cannot?
A vegan anniversary can feel meaningful, yet its scale is hard to picture. A Vegan Footprint Calculator turns elapsed time into a clear view of several environmental indicators. The Vegan Footprint Calculator on AxiCalculator keeps those indicators separate. That matters because each result answers a different question. You can see animal impact, water, grain, forest area, and carbon output without forcing them into one artificial score.
This changes the experience immediately. A date becomes something you can explore. A long period stops feeling like an abstract number. A short period also gains context. Instead of asking whether a few weeks matter, you can see how the model accumulates change across several categories.
Why cumulative results are easier to understand
People usually struggle with environmental information for one simple reason. The numbers often arrive without scale. A large figure may look impressive but still feel meaningless. A small figure may look unimportant even when it grows steadily.
A cumulative calculator solves part of that problem. It connects time with visible outcomes. You do not need to perform mental arithmetic. You also do not need to compare unrelated statistics from different pages. The main information stays in one place.
This is useful for personal tracking. It is also useful for teaching. A student can see how a repeated behavior changes a modeled result. A sustainability communicator can show several impact categories without building a spreadsheet first. A long-term vegan can look at the same journey from more than one angle.
Start with the result that matters most to you
Not every user cares about the same outcome. One person may focus on animals. Another may care more about climate. Someone else may be studying water or land pressure.
The better approach is not to declare one result universally superior. Start with the metric connected to your real question. Then read the other outputs as supporting context. That keeps the calculation useful without turning it into a competition between environmental concerns.
TIME SPENT VEGAN → SEPARATE IMPACT INDICATORS → CONTEXT → BETTER QUESTIONS
Why separate metrics protect meaning
A common problem appears when several environmental indicators are compressed into one score. The result may look convenient, but important meaning disappears. Water is not carbon. Land is not grain. Animal lives are not an area measurement.
AxiCalculator keeps these views separate. This gives the user more control. It also makes the result easier to explain. You can discuss one environmental dimension without pretending it represents everything.
That separation is especially useful in technical conversations. A clear result should tell you what is being described. It should not hide several different ideas behind a mysterious rating. A transparent interface reduces that confusion before it begins.
How Should You Read Water, Carbon, Grain, Forest, and Animal Results?
The hardest part often begins after the calculator shows a number. A result without interpretation can create false confidence. The goal is not merely to collect larger totals. The goal is to understand what each output represents inside the calculator’s model.
Read water as a resource indicator
The water result gives you a way to visualize cumulative resource demand. It can make a long duration easier to grasp. However, water impact is more complex in the real world. Geography matters. Agricultural systems differ. Rainfall and irrigation are not identical environmental pressures.
That does not make the displayed result useless. It changes how you should read it. Use it as a consistent model output. Do not treat it as a meter reading from your personal supply chain.
This distinction creates better conversations. Instead of saying, “This is exactly what happened,” you can ask, “What scale does this model suggest?” That question is more honest and usually more useful.
Read carbon as one part of environmental impact
Carbon gets more attention than most environmental metrics. That can make users assume it tells the whole story. It does not.
A carbon result is useful because it gives climate-related context. Yet food systems also interact with land, water, waste, biodiversity, and production choices. A single carbon total cannot describe all of those relationships.
Use the carbon output for the question it can answer. Then keep other indicators visible. This prevents one familiar metric from erasing the rest of the environmental picture.
Read grain and forest results as separate signals
Grain and forest outputs can look less familiar than carbon. That makes them easy to ignore. They are still useful because they show different resource dimensions.
The grain result offers a way to think about feed-related resource demand. The forest result gives land-related context. Neither should be treated as a literal record of a specific farm, field, or forest. Their value comes from showing how the calculator’s model scales with time.
That difference matters for trust. A good calculator should help you understand a model. It should not encourage you to mistake a modeled output for direct observation.
Read animal lives as an estimated impact count
The animal result can feel emotionally stronger than the resource results. That creates another interpretation challenge. Users may read the number as a list of individually identified animals. It is not.
The result represents an estimated count within the calculator’s model. It helps make cumulative dietary impact easier to visualize. It should be read at that level.
This framing keeps the number useful without adding emotional claims that the calculation cannot prove. Clear language strengthens the result rather than weakening it.
Look twice at any result that feels unusually powerful. Meaning matters as much as magnitude.
Why Does Reverse Solving Change the Way You Explore Vegan Impact?
Most calculators force the user to begin with the same input. That becomes frustrating when the value you know is actually a result. You may know a water target, a carbon amount, or another footprint figure. You may not know the duration behind it.
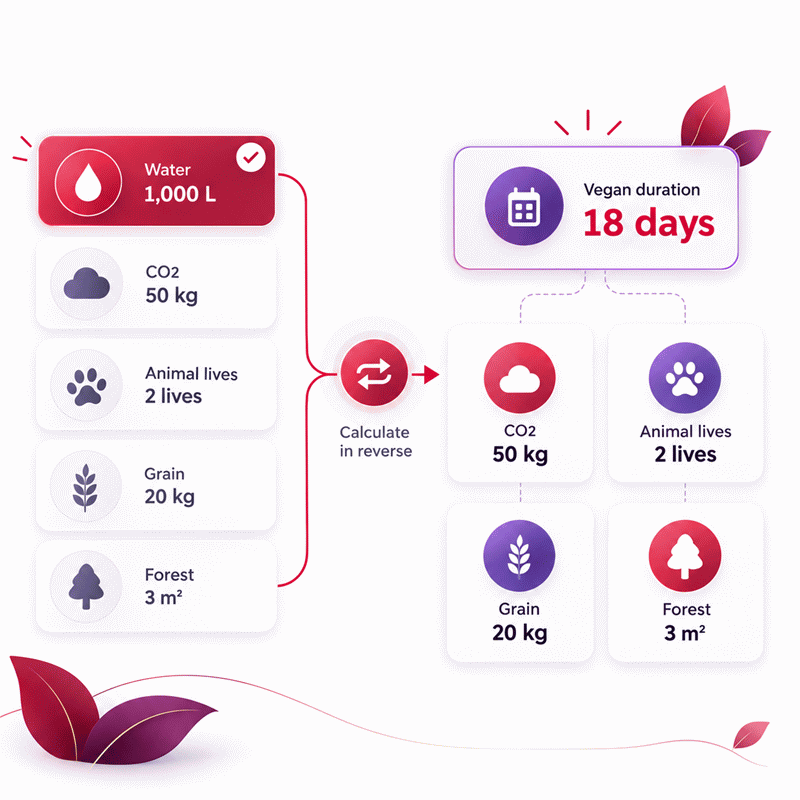
Reverse solving changes that workflow. It lets the calculator begin from the known quantity. The tool can then recover the equivalent duration and update the remaining outputs.
Start from the question you actually have
This sounds like a small interface feature. In practice, it changes the type of questions the tool can answer.
A forward-only calculator answers, “What does this duration produce?” A reverse-capable calculator can also explore, “What duration corresponds to this modeled result?” That second path supports planning and curiosity.
It also removes unnecessary steps. You do not need to rearrange the relationship on paper. You do not need another calculator. You do not need to guess a duration and keep adjusting it.
The field you know becomes the starting point. The rest of the interface follows that choice.
KNOWN RESULT → REVERSE SOLVING → EQUIVALENT DURATION → CONNECTED RESULTS
Reverse solving is useful for target-based thinking
People often think in targets rather than dates. That is normal. A learner may begin with a resource figure. A presenter may want to understand the time scale behind a displayed total. A user may simply see a number and wonder what duration would produce it.
Reverse solving supports those questions directly. It turns the calculator from a one-way form into an interactive model.
This creates a better learning experience. Changing one known value reveals how the other outputs relate. The user can test ideas quickly. That encourages exploration without demanding advanced mathematics.
A target is still a model target
A reverse result should not become a promise about future reality. It tells you the duration associated with a value inside the same calculator model.
That difference is important. Scenario exploration works best when the model stays consistent. Once a user understands that boundary, reverse solving becomes both powerful and easy to explain.
What Can Make a Vegan Footprint Estimate Misleading?
The biggest risk is not always a wrong calculation. A correct calculation can still be misunderstood. This happens when a general estimate is treated as a personal environmental audit.
Real diets are not identical
Two people can both describe themselves as vegan and eat very differently. One may rely on local whole foods. Another may use imported or heavily processed foods. Their energy sources, waste patterns, suppliers, and locations can also differ.
A duration-based tool does not observe those details. It gives a consistent scenario view instead.
This is why the calculator is most useful for exploration, education, and comparison inside its own framework. It should not be used to invent personal precision that was never measured.
Supply chains change the real environmental picture
Food does not appear at the point of purchase without a supply chain. Farming, processing, storage, packaging, transport, and retail can influence actual impact. Production methods can also vary widely.
A simple calculator cannot inspect every farm or supplier behind a user’s diet. That would require a very different system and far more input data.
The practical solution is transparency. Use the calculator for the question it was designed to explore. Use more detailed assessment methods when the decision demands them.
Previous eating patterns can change real differences
A person moving from a high-impact diet may experience a different real-world change from someone moving from an already plant-heavy diet. A fixed-duration model does not reconstruct that personal history.
This is not a reason to hide the result. It is a reason to interpret it correctly.
Good environmental communication does not require pretending uncertainty does not exist. It requires making the scope understandable. A clear boundary builds more trust than an unexplained claim of perfect accuracy.
False certainty is more dangerous than visible uncertainty
Users usually forgive an estimate when it is clearly described. They lose trust when an estimate is presented as a measurement.
This is one of the most important differences between a useful technical tool and a persuasive-looking number generator. The better tool shows what it can answer and leaves room for what it cannot observe.
That honesty also improves decision quality. Users can decide whether the current level of detail is enough. If it is not, they know when deeper analysis is needed.
Where Does a Vegan Footprint Calculator Create the Most Value?
A calculator loses value when users see a result and immediately leave. The useful moment comes next. The result should help someone think, compare, communicate, or decide.
Personal tracking becomes easier to visualize
Long-term habits are difficult to feel day by day. A cumulative view makes them easier to revisit. A user can return after another month or year and see a larger modeled picture.
This can support motivation without turning the page into a scoreboard. The goal is not to compete with other users. The goal is to understand your own timeline in a consistent way.
A simple interface also reduces friction. There is no need to maintain a private spreadsheet for a quick check. The user can open the tool and explore the result immediately.
Classroom learning becomes interactive
Environmental topics can become abstract when they remain inside paragraphs. An interactive calculator gives students something to manipulate.
They can change a duration and watch several results respond. They can start from a known output and work backward. They can discuss why different indicators should remain separate.
This turns passive reading into active questioning. That is valuable even when the class later moves to more advanced environmental models.
The calculator becomes a starting point rather than the final lesson.
Sustainability communication becomes clearer
Communicators often struggle with two extremes. Too little information feels vague. Too much technical detail overwhelms the audience.
A well-designed calculator sits between those extremes. It gives visible numbers while keeping the interaction simple. A reader can explore first and read deeper context afterward.
This structure works well for presentations, educational campaigns, personal milestones, and general sustainability conversations. It allows technical users to inspect the logic while casual users can still understand the main result.
Do not turn a simple result into an oversized claim
Clear communication is persuasive because it respects the reader. It does not need exaggerated promises.
A result becomes more credible when its meaning is easy to explain. If a user can describe what the calculator does in one sentence, the tool is easier to share and easier to trust.
How Can AxiCalculator Turn the Result Into a Better Decision?
The final problem is action. A result may be interesting, but interest alone does not change much. The next step should be obvious.
Use the calculator to compare scenarios
Change the duration and notice how the overall picture develops. Start from another known result and explore the corresponding timeline. Focus on one environmental metric when you need a narrow answer.
This makes AxiCalculator useful for more than a one-time curiosity. It becomes a small scenario workspace.
That is especially helpful when you need to explain a number to someone else. You can recreate the situation instead of sending an unexplained screenshot.
Keep the result connected to its context
A number is strongest when its meaning travels with it. When sharing a result, keep the calculator context attached. That lets another person inspect the same idea instead of trusting a copied number blindly.
This is a better form of credibility. The reader gets the result and the path used to explore it.
It also makes discussions easier. Two people can open the same tool, adjust the scenario, and talk about what changes. The conversation becomes testable rather than abstract.
Build a repeatable environmental learning workflow
Start with the question. Use the calculator. Read the separate outputs. Identify which result matters for your purpose. Then decide whether the model is detailed enough for the decision.
That sequence is simple, but it prevents several common mistakes. It reduces random searching. It prevents unrelated figures from being mixed together. It encourages users to understand the result before repeating it elsewhere.
AxiCalculator is designed around that practical workflow. The tool gives the number quickly, while the surrounding content explains how to think about it.
Move from curiosity to a useful next step
If you want to understand your vegan timeline, start with the calculator rather than manual arithmetic. Explore the result that matters most. Then look at the wider picture.
Bookmark AxiCalculator when you want to return later. Share the calculator when another person needs the same calculation. Explore related Ecology tools when your question expands beyond diet.
The best calculator is not the one with the loudest claim. It is the one that helps you reach a clear answer, understand what that answer means, and know what to do next.
Frequently Asked Questions
Can I use the calculator if I became vegan gradually rather than on one exact date?
Why should I look at several footprint outputs instead of only CO2?
What is the most useful way to compare my result over time?
Can I use the calculator to explain vegan impact to friends or students?
Can an environmental team use this result in a formal carbon inventory?
How should an analyst document a reverse-solved footprint scenario?
What should a researcher verify before citing a calculator result in a report?
Engineering Resources
Our engineers are here to help you get it right.