Christmas Tree Footprint Calculator
- Last formula update:

Decimal & Rounding Policy
- All calculations use full internal precision without rounding intermediate values.
- Carbon footprint results are rounded only when displayed to the user.
- Values below 100 use up to four decimal places when meaningful.
- Values from 100 to 9,999 use up to two decimal places.
- Values of 10,000 or more are displayed as whole numbers.
- Trailing zeros and unnecessary decimal points are removed automatically.
- Reverse calculations use the unrounded target value whenever sufficient precision is available.
- Unit conversions occur before final display rounding to minimize conversion error.
Valid range
- Tree height: 0.3 to 12 m, with equivalent supported-unit values accepted.
- Tree source-to-shop distance: 0 to 50,000 km.
- Tree pickup distance: 0 to 5,000 km.
- End-of-life transport distance: 0 to 5,000 km.
- Plastic tree weight: 0.1 to 200 kg.
- Plastic tree lifetime: 1 to 100 years.
- Alternative plastic tree lifetime: 1 to 100 years.
- Distances may be zero when no transport occurs for that stage.
- Negative, non-finite, incompatible, or unsupported values are rejected.
- Reverse solving is allowed only when exactly one supported numeric variable is unknown.

Tivessa Zorquell
Reviewers:
Veralisse Noxmere
Sarven Kestthorne
Check our editorial policy
September 12, 2026
1.0.0
Initial calculator and formula release.
Our engineers are here to help you get it right.
How Can a Christmas Tree Footprint Calculator Help You Choose a Lower-Carbon Tree?
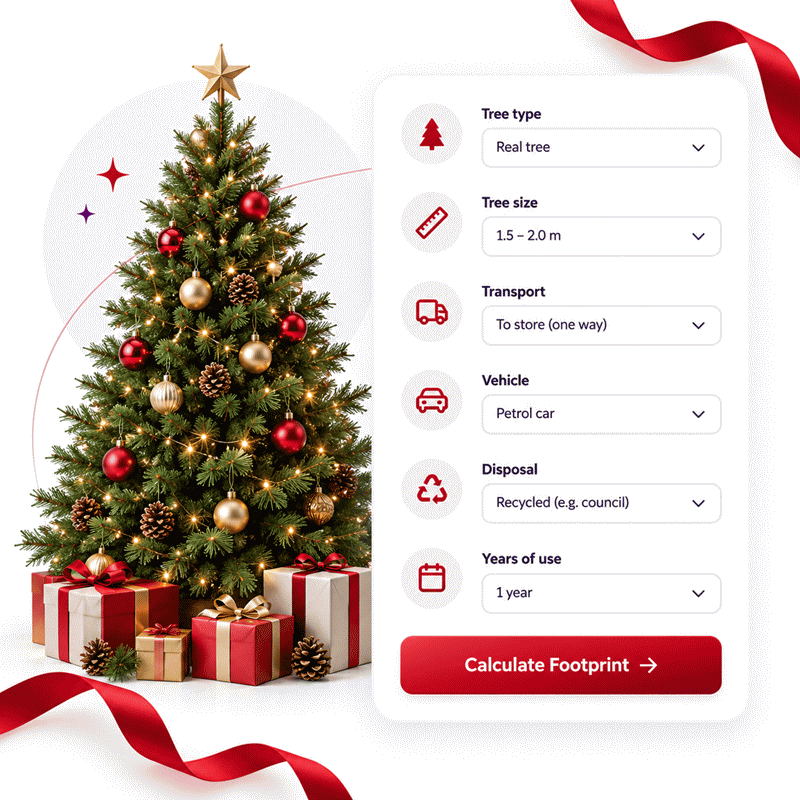
Christmas Tree Footprint Calculator results become useful when they reflect your real tree, journey, disposal plan, and reuse behavior rather than a generic “real versus artificial” rule. AxiCalculator compares the lifecycle factors that can change your estimated greenhouse-gas impact and reports the result in CO2e.
- Natural-tree results can change with tree size, source distance, pickup travel, and end-of-life route.
- Artificial-tree comparisons depend strongly on embodied impact and how many years the same tree remains in use.
- Landfill, composting, mulching, recycling, and continued reuse should not be treated as equivalent outcomes.
- A dedicated vehicle journey can add emissions that simple tree-only comparisons overlook.
- Keeping an existing reusable tree can avoid creating another replacement cycle.
- CO2e provides a common climate-impact unit for comparing greenhouse-gas effects.
The Christmas Tree Footprint Calculator is most valuable as a scenario tool: calculate your current plan, change one realistic decision, and compare the difference. The lowest-impact choice depends on the complete lifecycle scenario, not the tree label alone.
Assumptions used in this calculator
- Tree size presets represent approximate heights rather than exact botanical dimensions.
- Natural-tree carbon storage is represented using a reference conifer growth model.
- Roots and remaining stump material are excluded from the tree footprint.
- Growth-stage irrigation at the customer’s home is not included.
- Tree stands and decorative accessories are excluded from lifecycle emissions.
- Driving distances represent one-way travel and are doubled for pickup trips.
- Walking and sled pickup are treated as having zero direct transport emissions.
- Vehicle emissions vary by engine type and selected vehicle year.
- Landfill decomposition includes the greater climate effect of methane formation.
- Composting and mulching receive credit for replacing some conventional treatment needs.
- Plastic-tree packaging is excluded from the modeled artificial-tree weight.
- Reusable-material alternatives assume the required items are already owned.
- Results are estimates and may differ from location-specific lifecycle assessments.
Results are rounded for display.
Internal calculations use full precision.
Formulas Used in Christmas Tree Footprint Calculato :
1. Natural Tree Size Scaling Factor
2. Natural Tree End-of-Life Impact
3. Source-to-Shop Transport Impact
4. Customer Pickup Impact
5. End-Point Transport Impact
6. Total Natural Tree Footprint
7. Vehicle Year Adjustment
8. Plastic Tree Height Scaling Factor
9. Plastic Tree Weight Scaling Factor
10. Plastic Tree Embodied Footprint
11. Plastic Tree Lifetime and Annualized Footprint
12. Alternative Tree Size Scaling
13. Reused-Material Alternative Footprint
14. Alternative Material Quantity
15. Carbon Footprint Saving
16. Plastic Tree Break-Even Period
17. Reverse Natural Tree Source Distance
18. Reverse Natural Tree Pickup Distance
19. Reverse Natural Tree End-Point Distance
20. Reverse Plastic Tree Years of Use
21. Reverse Plastic Tree Pickup Distance
22. Reverse Plastic Tree Weight
- H = selected or custom tree height in meters.
- Hn,ref = 2 m natural-tree reference height.
- Hp,ref = 2.13 m plastic-tree reference height.
- Hmedium = 2.13 m medium alternative-tree height.
- Sn = natural-tree size scaling factor.
- Sh = plastic-tree height scaling factor.
- Sw = plastic-tree weight scaling factor.
- Salt = alternative-tree size scaling factor.
- W = plastic-tree weight in kilograms.
- Wref = 8 kg plastic-tree reference weight.
- Fdisposal = selected natural-tree end-of-life factor in kg CO2e.
- Fsource = 0.00017 kg CO2e per km source freight factor.
- FendTransport = 0.00030 kg CO2e per km end-point transport factor.
- Fvehicle = selected vehicle emission factor in kg CO2e per km.
- Fpublic = 0.055 kg CO2e per passenger-km.
- Fpetrol = 0.192 kg CO2e per km.
- Yvehicle = vehicle-year efficiency adjustment factor.
- Yref = reference vehicle-year adjustment used for plastic-tree pickup.
- Dsource = source-to-shop distance in kilometers.
- Dpickup = one-way customer pickup distance in kilometers.
- Dend = distance to the selected end point in kilometers.
- Eend = natural-tree biological and end-of-life impact.
- Esource = source-to-shop transport emissions.
- Epickup = customer pickup emissions.
- EendTransport = end-point transport emissions.
- Ep,ref = 29.394 kg CO2e plastic-tree reference embodied footprint.
- Eembodied = calculated plastic-tree embodied footprint.
- EplasticPickup = plastic-tree pickup emissions.
- Eplastic,lifetime = embodied plus pickup emissions over the tree lifetime.
- Eplastic = annualized plastic-tree footprint.
- Balt = medium-size footprint assigned to the selected reused-material alternative.
- Qmedium = medium-size item quantity assigned to the selected alternative.
- Qalt = required number of reusable items.
- Ecurrent = calculated footprint of the current tree.
- Ealt = calculated footprint of the selected alternative.
- Esaved = difference between current and alternative footprints.
- Etarget = user-entered target footprint used for reverse solving.
- EknownTransport = sum of all already-known transport components.
- N = number of years a plastic tree is used.
Variables & Definitions
View a complete list of all variables used in this calculator, including definitions and units
Christmas Tree Footprint Calculator Variables and Calculation Parameters
| Variable | Meaning | Base Unit | Typical Source | Role in Calculation |
|---|---|---|---|---|
| H | Selected or custom tree height | m | User input or size preset | Scales natural and plastic tree impacts |
| Hn,ref | Natural-tree reference height | m | Model constant | Reference for natural-tree size scaling |
| Hp,ref | Plastic-tree reference height | m | Model constant | Reference for plastic-tree height scaling |
| Hmedium | Medium alternative-tree height | m | Model constant | Reference for alternative size scaling |
| Sn | Natural-tree size scaling factor | dimensionless | Calculated | Adjusts natural-tree lifecycle components |
| Sh | Plastic-tree height scaling factor | dimensionless | Calculated | Adjusts embodied plastic-tree impact |
| Sw | Plastic-tree weight scaling factor | dimensionless | Calculated | Adjusts embodied plastic-tree impact |
| Salt | Alternative-tree size scaling factor | dimensionless | Calculated | Adjusts alternative footprint and item count |
| W | Plastic-tree weight | kg | User input | Scales embodied plastic-tree emissions |
| Wref | Plastic-tree reference weight | kg | Model constant | Reference for weight scaling |
| Dsource | Tree source-to-shop distance | km | User input | Calculates upstream freight emissions |
| Dpickup | One-way customer pickup distance | km | User input | Calculates round-trip pickup emissions |
| Dend | Distance to disposal or reuse endpoint | km | User input | Calculates end-point transport emissions |
| Fdisposal | Selected end-of-life footprint factor | kg CO2e | Disposal selection | Represents disposal or recovery pathway impact |
| Fsource | Source freight emission factor | kg CO2e/km | Model constant | Converts source distance to emissions |
| FendTransport | End-point freight factor | kg CO2e/km | Model constant | Converts end-point distance to emissions |
| Fvehicle | Vehicle emission factor | kg CO2e/km | Engine selection | Calculates driving emissions |
| Fpublic | Public transport emission factor | kg CO2e/passenger-km | Model constant | Calculates public transport pickup emissions |
| Yvehicle | Vehicle-year efficiency adjustment | dimensionless | Calculated from year | Adjusts vehicle emission intensity |
| Ep,ref | Reference plastic-tree embodied footprint | kg CO2e | Model constant | Base for artificial-tree lifecycle calculations |
| Forigin | Manufacturing-origin adjustment factor | dimensionless | Origin selection | Adjusts plastic-tree embodied footprint |
| N | Plastic-tree years of use | years | User input or reverse result | Annualizes lifetime footprint |
| Eend | Natural-tree end-of-life impact | kg CO2e | Calculated | Lifecycle footprint component |
| Esource | Source-to-shop transport impact | kg CO2e | Calculated | Lifecycle footprint component |
| Epickup | Customer pickup impact | kg CO2e | Calculated | Lifecycle footprint component |
| EendTransport | End-point transport impact | kg CO2e | Calculated | Lifecycle footprint component |
| Enatural | Total natural-tree footprint | kg CO2e | Calculated | Primary natural-tree result |
| Eembodied | Plastic-tree embodied footprint | kg CO2e | Calculated | Plastic manufacturing footprint |
| Eplastic,lifetime | Total plastic-tree lifetime footprint | kg CO2e | Calculated | Used for annualization and break-even |
| Eplastic | Annualized plastic-tree footprint | kg CO2e/year | Calculated | Comparable annual footprint |
| Balt | Medium-size alternative base footprint | kg CO2e | Alternative selection | Base impact for reused-material alternatives |
| Qmedium | Medium-tree material quantity | items | Alternative selection | Reference item requirement |
| Qalt | Required alternative-tree item quantity | items | Calculated | Shows material requirement |
| Ealt | Alternative-tree footprint | kg CO2e | Calculated | Alternative comparison result |
| Esaved | Footprint saved versus current tree | kg CO2e | Calculated | Comparison result |
| Etarget | User-entered target footprint | kg CO2e | Reverse input | Target for solving one unknown parameter |
| Nbreak-even | Plastic-tree break-even period | years | Calculated | Years needed to offset repeated current-tree impact |
Unit Conversion Table
Distance Unit Conversion Table
| Unit Group | Unit Name | Symbol | Equivalent in Kilometers | Used For |
|---|---|---|---|---|
| Popular Units | Kilometer | km | 1 km | Source, pickup, and end-point distances |
| Popular Units | Mile | mi | 1.609344 km | Source, pickup, and end-point distances |
| Scientific Units | Meter | m | 0.001 km | Short transport distances |
Tree Height Unit Conversion Table
| Unit Group | Unit Name | Symbol | Equivalent in Meters | Used For |
|---|---|---|---|---|
| Popular Units | Meter | m | 1 m | Custom tree height |
| Popular Units | Foot | ft | 0.3048 m | Custom tree height |
| Scientific Units | Centimeter | cm | 0.01 m | Custom tree height |
Plastic Tree Mass Unit Conversion Table
| Unit Group | Unit Name | Symbol | Equivalent in Kilograms | Used For |
|---|---|---|---|---|
| Popular Units | Kilogram | kg | 1 kg | Plastic tree weight |
| Popular Units | Pound | lb | 0.45359237 kg | Plastic tree weight |
| Scientific Units | Gram | g | 0.001 kg | Plastic tree weight |
Carbon Footprint Unit Conversion Table
| Unit Group | Unit Name | Symbol | Equivalent in Kilograms CO2e | Used For |
|---|---|---|---|---|
| Popular Units | Kilogram CO2 Equivalent | kg CO2e | 1 kg CO2e | Footprint results and reverse targets |
| Popular Units | Pound CO2 Equivalent | lb CO2e | 0.45359237 kg CO2e | Footprint results and reverse targets |
| Scientific Units | Gram CO2 Equivalent | g CO2e | 0.001 kg CO2e | Small footprint results |
Example Calculation
The calculation first scales the end-of-life impact to the selected tree height.
Transport is then calculated separately for freight, customer pickup, and disposal movement.
The petrol pickup trip is treated as a round trip and adjusted by vehicle year.
Intermediate values retain full precision, while only the displayed result is rounded.
The target footprint replaces the normal calculated output and becomes the known value.
All known lifecycle components are subtracted before solving the missing pickup contribution.
The remaining emissions are divided by the round-trip petrol emission coefficient.
The solved physical value is retained at full precision before final display rounding.
Results are rounded for display.
Internal calculations use full precision.
Calculations Disclaimer
What Really Changes Your Christmas Tree Carbon Footprint?
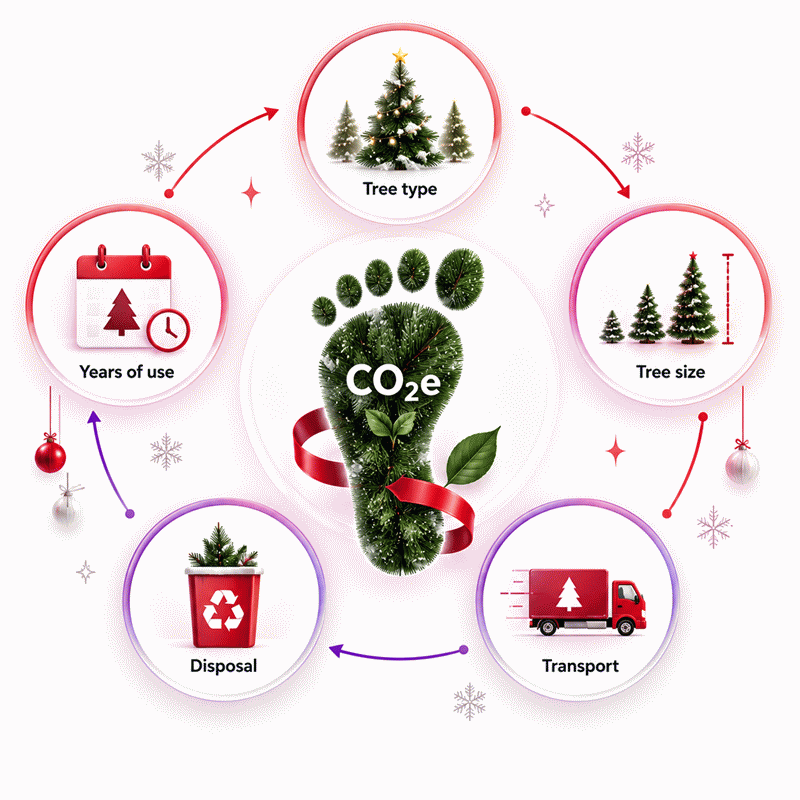
You can buy a tree that looks sustainable and still make a high-impact choice. The Christmas Tree Footprint Calculator avoids that shortcut. It looks at the decisions surrounding the tree, not only the label attached to it. Tree type matters, but so do size, transport, pickup, disposal and reuse.
The most useful question is therefore not, “Which tree is green?” Ask, “Which complete tree scenario creates the lower footprint for me?” That small change in thinking prevents many poor comparisons.
Consider two households buying similar natural trees. One collects its tree locally and sends it for an appropriate recovery route. Another makes a long dedicated car journey and later drives the tree to a distant disposal point. The trees may look identical. Their calculated footprints need not be.
The same principle applies to artificial trees. A tree bought for one season carries its embodied impact over very little use. Keep the same tree for many Christmases, and that impact is distributed across a longer service life. Reuse is therefore not a decorative detail. It changes the comparison.
A useful result starts with realistic inputs. Enter the journey you expect to make. Select the disposal route you can actually access. Use a realistic reuse period. Avoid choosing ideal values simply because they produce a better result.
This is where AxiCalculator becomes more useful than a simple real-versus-artificial rule. You can change one decision at a time. That shows whether distance, disposal, tree size or reuse is driving the outcome.
Real or Artificial Christmas Tree: Which Has the Lower Carbon Footprint?
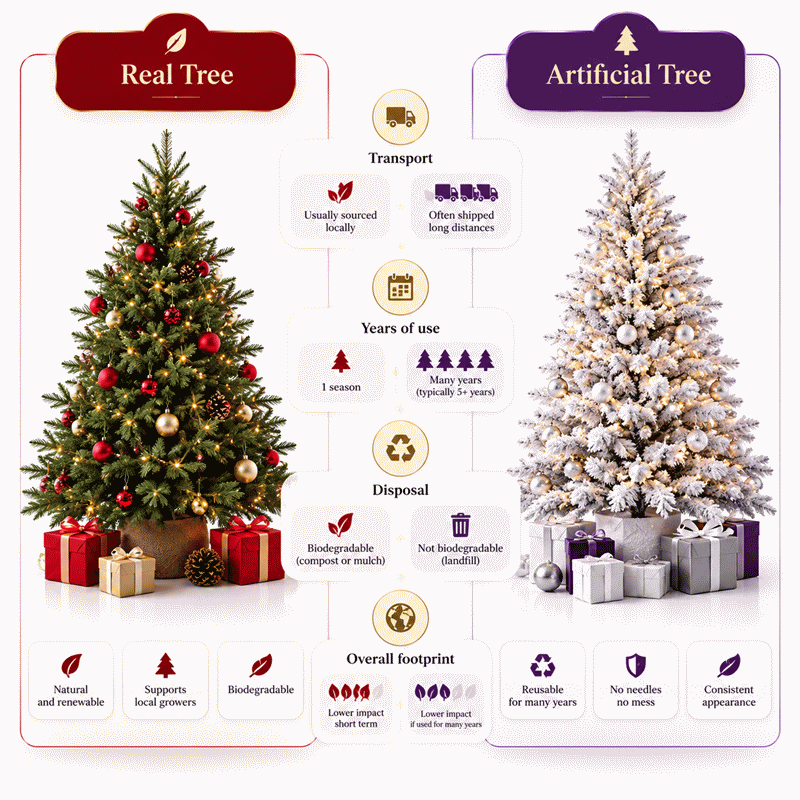
The frustrating problem is that both answers can be correct. A natural tree can perform well in one scenario and poorly in another. An artificial tree starts with an embodied manufacturing burden, yet long service life can spread that impact across many seasons.
For a natural tree, end-of-life deserves special attention. Organic material handled through different waste routes does not produce identical climate outcomes. Sending a tree to landfill is therefore not equivalent to mulching, composting, recycling or keeping a living potted tree in use.
For an artificial tree, the central question is longevity. Buying a durable product and keeping it can produce a very different annual comparison from replacing artificial trees frequently. The practical lesson is simple: if you already own a usable artificial tree, its previous manufacturing impact has already occurred. Replacing it merely to buy something marketed as greener can create another production cycle.
Why the Answer Changes With Your Actual Scenario
A lifecycle comparison has boundaries. Change those boundaries and the answer may change. One estimate may include manufacturing and disposal. Another may include customer travel. A third may model freight routes in greater detail.
This explains why a single internet number should not become a universal rule. The better approach is scenario analysis. Keep the method consistent, then compare realistic alternatives using the same boundary.
Start with the variables you control. How far will you travel? Will the journey be dedicated to buying the tree? How will the tree leave your home? If it is artificial, how long will you genuinely keep it? These questions turn a generic environmental debate into a decision you can act on.
When Keeping Your Existing Artificial Tree Makes More Sense
A common mistake appears when someone already owns an artificial tree. They compare a new natural tree with the original manufacturing impact of the artificial tree every year. That does not describe the same decision.
For an existing product, continued reuse can extend service life without repeating its manufacturing stage. The decision is then about continued use versus replacement. This is different from deciding which new tree to buy today.
Storage condition matters too. Protect branches, connectors and stands from moisture and damage. Store the tree in a durable container. Avoid crushing sections that shorten its usable life. A longer useful life makes the original purchase work harder.
How Does a Natural Christmas Tree Create Lifecycle Emissions?
A natural tree can look simple, yet its path contains several stages. It grows, moves through a supply chain, reaches the buyer and finally enters an end-of-life route. Your personal journey can add another transport stage.
A useful model keeps those stages separate. This makes the result easier to inspect. If the footprint rises sharply, you can identify the reason rather than seeing only one unexplained number.
Tree Size and the Impact of Scaling
Size is easy to underestimate. A taller tree is not simply the same object stretched upward. Biomass, handling and lifecycle characteristics can change with dimensions. A scaling model therefore gives tree height a meaningful role rather than treating every natural tree as identical.
Measure height consistently. Do not enter feet into a field interpreted as meters. Do not switch between a nominal retail size and a precise measurement halfway through a comparison. Consistency matters more than displaying excessive digits.
Why Source-to-Shop Distance Matters
Your tree may travel before you ever see it. Source-to-shop movement represents this upstream stage. A local-looking retail location does not necessarily mean the tree was locally grown.
Distance alone is not the whole story. Freight mode and load sharing also matter in real supply chains. Still, separating upstream distance from personal pickup is valuable. It prevents two very different transport stages from being treated as one journey.
For practical decision-making, ask the seller where the tree was grown. A clear origin gives you better input data and can reveal whether two apparently similar options have very different supply routes.
How Your Pickup Journey Changes the Result
A dedicated car trip can be surprisingly important. The journey normally includes getting to the seller and returning home. A one-way distance should therefore not be mistaken for total travel.
Transport choice changes the scenario. Walking or another direct non-motorized pickup does not carry the same modeled vehicle emissions as a petrol-car trip. Public transport also uses a different basis from a private vehicle.
There is an easy behavioral win here. Combine the tree pickup with an existing necessary trip when practical. More importantly, avoid driving far merely because a tree carries a vague “eco” label. A sustainability claim cannot erase the journey required to obtain the product.
Why End-of-Life Choice Can Change the Outcome
The tree leaves your living room, but its lifecycle does not stop at the door. The next destination matters.
Landfill can be particularly important because organic material may decompose under oxygen-limited conditions. Other routes can handle the material differently. Local systems vary, so the best practical action is to check the route that your municipality actually uses.
Do this before Christmas rather than after it. Find the collection service, opening date and accepted tree condition. Remove lights, ornaments, plastic and other prohibited materials. A good disposal plan is easier to follow when it already exists.
How Does an Artificial Christmas Tree Footprint Change Over Time?
The biggest buying mistake is judging an artificial tree by purchase price or appearance alone. Its environmental profile is strongly connected to material production, manufacturing, transport and service life.
Artificial trees commonly combine different materials. That makes their lifecycle different from a natural tree. It also means product weight, construction and origin can matter when a detailed model is used.
Embodied Impact Before the First Christmas
An artificial tree arrives with much of its impact already embodied in the product. Raw materials were produced. Components were manufactured. The tree was assembled and transported.
This creates an important decision rule. Do not buy an artificial tree with a short replacement cycle in mind. Look for construction that can survive assembly, disassembly and storage repeatedly.
Inspect the stand, hinges, branch attachment points and electrical components on pre-lit models. A tree that becomes unusable because one critical part fails cannot deliver the long service life assumed in an optimistic comparison.
Why Reuse Years Can Transform the Annual Footprint
Suppose an artificial tree carries a fixed lifetime impact before repeated household use. Comparing that entire amount against one year of a natural tree would answer the wrong question when the artificial tree will be used repeatedly.
Annualization asks how much of that lifetime impact corresponds to each year of use. As the reuse period increases, the allocated amount per season falls.
This does not make the original emissions disappear. It changes the functional comparison. One durable product is serving the household across several Christmases rather than one.
The key word is actual. A planned fifteen-year life has little meaning if the tree is replaced after four years. Use a duration that reflects your buying habits, storage conditions and product quality.
What Does Carbon Break-Even Really Mean?
Break-even sounds like a universal threshold. It is not. It belongs to a specific comparison.
Imagine an artificial-tree scenario compared with buying a particular natural tree every year. The break-even point describes when the cumulative comparison reaches parity under those assumptions. Change the natural-tree disposal route, transport distance, artificial-tree characteristics or reuse conditions, and the threshold can move.
This is why a calculator is more useful than memorizing one number. Test your own inputs. Then ask which assumptions are driving the crossing point.
Which Christmas Tree Choice Fits Your Real-Life Situation?
Most buyers do not need an abstract environmental winner. They need the best action available from where they are now.
For Households Buying a Fresh Natural Tree
Focus first on distance and end-of-life. A nearby source and a practical recovery route give you two levers you can control without changing the tradition of using a real tree.
Ask where the tree was grown. Plan the pickup route. Confirm the local collection method. These three actions are simple, yet they produce better input data and reduce guesswork.
For Households That Already Own an Artificial Tree
Do not let a new sustainability label convince you to discard a serviceable product automatically. Extending useful life can be the more rational first move.
Repair minor problems where safe. Replace compatible non-structural parts when appropriate. Store sections carefully. Keep the original stand and hardware together. The goal is straightforward: avoid premature replacement.
For Buyers Choosing a New Artificial Tree
Think in years, not only in checkout price. Durability determines whether your intended reuse scenario can happen.
Check construction quality and replaceable parts. Consider size carefully so the tree still fits future homes. Avoid trend-driven designs that you already expect to replace. A neutral, repairable and well-stored tree has a better chance of staying useful.
For Low-Waste DIY and Reused-Material Trees
A DIY alternative is not automatically impact-free. Buying dozens of new objects solely to create a “reused” tree defeats much of the idea.
The strongest version uses materials you already own. Books, cardboard or reusable household objects can become temporary displays without requiring another purpose-built seasonal product.
After Christmas, return those materials to their normal use. That is what makes the reuse story meaningful.
How Can You Reduce Christmas Tree Emissions Without Guesswork?
The quickest improvement is not always changing tree type. Start with the variables that you can change cheaply.
Cut Unnecessary Transport Before Changing Tree Type
Check nearby suppliers before planning a dedicated long-distance trip. Combine necessary journeys where practical. Compare the actual travel required for each option.
This is especially useful when two tree choices have similar modeled footprints. Transport can become the deciding variable rather than a footnote.
Choose the End-of-Life Route Before Purchase Day
A disposal plan made in January is often rushed. Decide earlier. Find the local collection or recovery route and understand what it accepts.
This also prevents a common failure: buying a supposedly sustainable product without knowing whether the local waste system can handle it as expected.
Keep Reusable Products in Service Longer
Reuse is a practical form of demand reduction. It avoids replacing a functioning object merely to obtain a newer version.
For artificial trees, longevity begins at purchase and continues through storage. Buy for repeated assembly. Handle the tree carefully. Protect it between seasons. Keep replacement decisions based on function rather than fashion.
How Should You Interpret a Christmas Tree CO2e Result?
A calculator result is an estimate, not a laboratory measurement of your individual tree. That distinction protects you from false precision.
Use the number to compare scenarios under one consistent method. Change one variable. Observe the direction and size of the change. That sensitivity is often more useful than arguing over tiny differences between two rounded totals.
Why Two Credible Estimates Can Still Be Different
Different models can use different datasets, system boundaries and assumptions. One may emphasize disposal. Another may include detailed transport. Another may use a different artificial-tree mass or manufacturing route.
Disagreement therefore does not automatically mean one result is fraudulent. First compare what each estimate includes.
A trustworthy calculator should make its logic inspectable. You should know what you entered, what scenario was modeled and what the output represents.
What the Calculator Can and Cannot Tell You
AxiCalculator can help compare modeled carbon-footprint scenarios. It can show how selected inputs affect the estimated result. It can also help identify which decision deserves attention.
It cannot certify the exact lifecycle footprint of a specific physical tree without product-specific supply-chain data. It cannot know an unknown manufacturing process or future disposal route. It should not turn missing evidence into invented precision.
That limitation is useful. It tells you when better data would improve the decision.
Turn the Result Into a Better Christmas Tree Decision
Run your current plan first. Save that result as your baseline. Then change only one practical variable: reduce the pickup distance, choose an available recovery route, or extend the planned life of an artificial tree.
Compare the new result with the baseline. If the difference is meaningful, you have found an actionable lever. If it barely changes, test another variable.
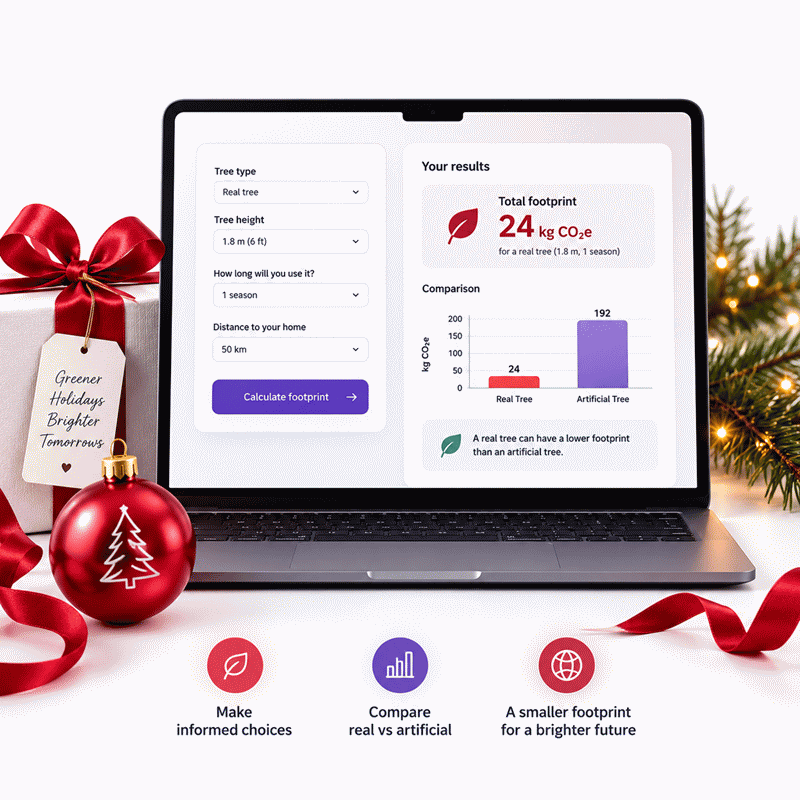
This turns the Christmas Tree Footprint Calculator into more than a number generator. It becomes a decision tool. You can see what matters, ignore changes that achieve little, and choose a realistic lower-impact route without relying on slogans.
Use AxiCalculator before the purchase, not after it. A few minutes of scenario testing can reveal whether the biggest opportunity is the tree itself, the journey, the disposal plan or simply keeping what you already own.
Frequently Asked Questions
1. What information should I collect before calculating my Christmas tree footprint?
2. Should I replace an artificial tree that I already own with a natural tree?
3. Why can disposal change a natural tree's footprint so much?
4. Can a locally grown Christmas tree still have a relatively high footprint?
5. How should an engineer compare two results that differ by only a small amount?
6. How can I audit a reverse-solved Christmas tree result?
7. Why might an LCA result disagree with this calculator even when both calculations are correct?
Engineering Resources
Our engineers are here to help you get it right.