Time Percentage Calculator
- Last formula update:
Decimal & Rounding Policy
- Decimal values are supported for time durations and percentage calculations.
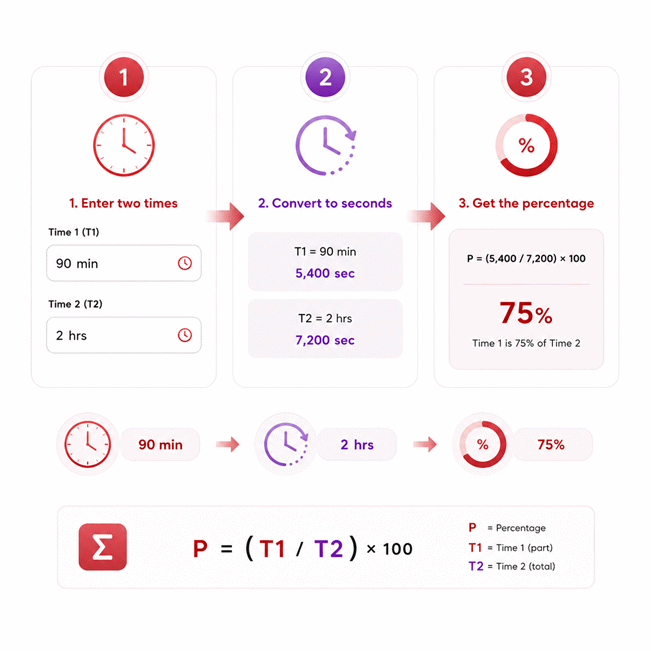
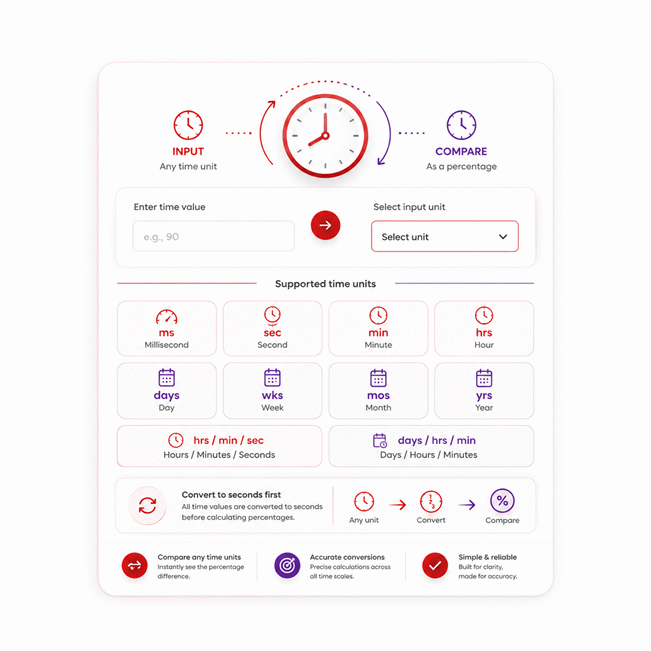
- All time values are converted to seconds before calculations to maintain consistent precision.
- Calculations use full internal precision, with no rounding during intermediate steps.
- Final percentage results are rounded only for clear display, such as 33.33%, 8.333%, or 4.167%.
- Unnecessary trailing zeros are removed while preserving meaningful decimal accuracy.
- Changing time units does not change the underlying duration or calculation accuracy.
Valid range
- First time duration (T1): Must be a finite value greater than 0 and within the calculator’s supported time range.
- Second time duration (T2): Must be a finite value greater than 0 to calculate a valid time percentage.
- Percentage result (P): Must be greater than 0 for reverse calculations, and values above 100% are valid.
- Calculation method: Any two valid variables determine the third, with all time durations converted to seconds before applying the fixed formulas.
- Invalid values: Empty, zero, negative, non-numeric, infinite, or unsupported values are excluded from calculation.

Cerelia Daxbourne
Reviewers:
Melovia Pexford
Iskren Lumthorne
Check our editorial policy
August 29, 2026
1.0.0
Initial calculator and formula release.
Our engineers are here to help you get it right.
How Does the Time Percentage Calculator Compare and Reverse-Solve Time Durations?
Time Percentage Calculator results show how one time duration compares with another. Enter any two known values from the first duration, second duration, and percentage. The remaining value is calculated automatically. Different time units can be used because durations are normalized before comparison.
- The first duration represents the time being compared.
- The second duration acts as the reference time.
- The percentage shows the first duration relative to the second.
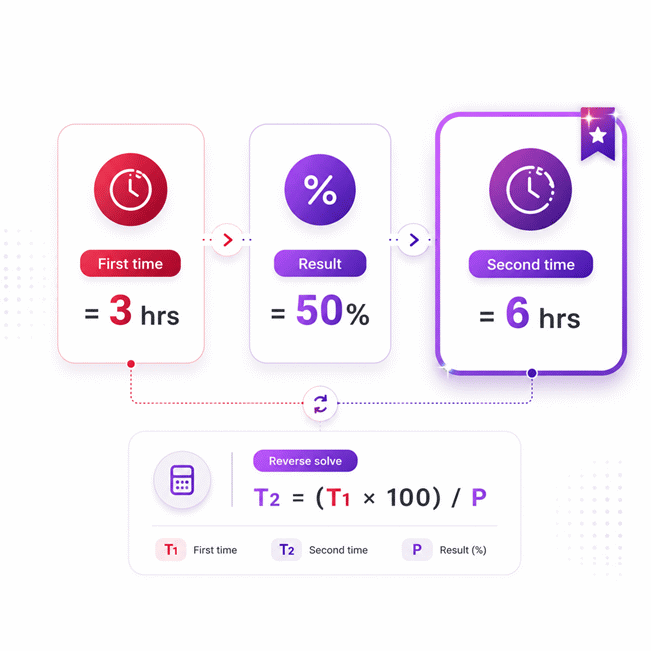
- Reverse solving can find either missing duration from the percentage.
- Minutes, hours, days, weeks, months, years, and compound durations are supported.
- Changing a time unit changes its display, not its actual duration.
- Percentages above 100% are valid when the first duration is longer.
- Zero or negative reference durations cannot produce a valid comparison.
- Compound time entries help prevent confusion between decimal and clock-style time.
- The two most recently edited values remain inputs during reverse solving.
The Time Percentage Calculator is useful for work schedules, project tracking, study plans, media progress, time allocation, and duration comparisons. It provides a fast way to understand relative time without manually converting units or rearranging the calculation.
Assumptions used in this calculator
- All time durations are treated as positive, finite measurement values.
- Time inputs are normalized to seconds before percentage calculations are performed.
- The calculation assumes both compared durations represent compatible time quantities.
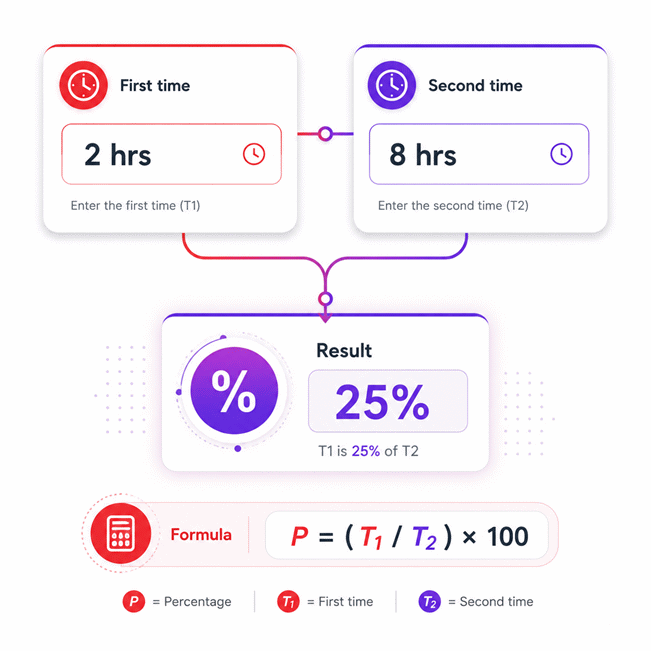
- Percentage equals the first duration divided by the second, multiplied by 100.
- Any two valid main variables can determine the remaining variable.
- Percentage values above 100% are valid when the first duration is longer.
- Zero or negative durations are not considered valid calculator inputs.
- Reverse calculations require a positive, nonzero percentage value.
- Month conversions use a fixed average duration of 30.4375 days.
- Year conversions use a fixed duration of 365.25 days.
- Week conversions use exactly seven days per week.
- Intermediate calculations retain full precision until final display formatting.
- Displayed decimals may be rounded without changing the underlying calculation.
Results are rounded for display.
Internal calculations use full precision.
Formulas Used in Time Percentage Calculator :
1. Simple Time Unit Conversion
2. Hours, Minutes, and Seconds Conversion
3. Days, Hours, and Minutes Conversion
4. Time Percentage Calculation
Reverse calculations use this same locked relationship by isolating the unknown variable. No separate independent equation is required, and calculations retain full precision until the displayed result is formatted.
Variable Definitions
- Ts = a time duration normalized to seconds.
- x = the entered numerical time value.
- fu = the conversion factor from the selected simple unit to seconds.
- h = the hours component of a compound time duration.
- m = the minutes component of a compound time duration.
- s = the seconds component of a compound time duration.
- d = the days component of a compound time duration.
- T1,s = the first time duration normalized to seconds.
- T2,s = the second time duration normalized to seconds.
- P = the percentage represented by the first duration relative to the second duration.
Variables & Definitions
View a complete list of all variables used in this calculator, including definitions and units
Time Percentage Calculator Variables and Units
| Variable | Meaning | Unit | Role in the Calculation |
|---|---|---|---|
| Ts | Time duration normalized to the calculator's base time unit | seconds | Provides a common basis for comparing durations entered in different units |
| x | Numerical value entered for a simple time unit | selected time unit | Multiplied by the selected unit conversion factor to obtain Ts |
| fu | Conversion factor of the selected simple time unit | seconds per selected unit | Converts x into the equivalent duration in seconds |
| h | Hours component of a compound time duration | hours | Used when converting compound hour-based or day-based time entries to seconds |
| m | Minutes component of a compound time duration | minutes | Used when converting compound time entries to seconds |
| s | Seconds component of an hours, minutes, and seconds duration | seconds | Provides the seconds portion of the compound duration |
| d | Days component of a days, hours, and minutes duration | days | Provides the day portion when normalizing a compound duration to seconds |
| T1,s | First time duration after normalization | seconds | Acts as the numerator when calculating the time percentage |
| T2,s | Second time duration after normalization | seconds | Acts as the reference duration and denominator in the percentage calculation |
| P | Percentage represented by the first duration relative to the second duration | % | Calculated from T1,s and T2,s, or used with either duration for reverse calculation |
Unit Conversion Table
Time Unit Conversion Table
| Unit Group | Unit Name | Symbol | Equivalent in Seconds | Used For |
|---|---|---|---|---|
| Scientific Units | Millisecond | ms | 1 ms = 0.001 sec | Very short durations and high-resolution time measurements |
| Popular Units | Second | sec | 1 sec = 1 sec | Base-unit normalization and general time calculations |
| Popular Units | Minute | min | 1 min = 60 sec | Short-duration comparisons and everyday time calculations |
| Popular Units | Hour | hrs | 1 hr = 3,600 sec | Work periods, schedules, elapsed time, and duration comparisons |
| Popular Units | Day | days | 1 day = 86,400 sec | Multi-day schedules, project periods, and extended durations |
| Popular Units | Week | wks | 1 wk = 604,800 sec | Longer schedules and comparisons based on seven-day weeks |
| Popular Units | Month | mos | 1 mo = 2,629,800 sec | Average-duration comparisons using a fixed 30.4375-day month |
| Popular Units | Year | yrs | 1 yr = 31,557,600 sec | Long-term comparisons using a fixed 365.25-day year |
| Popular Units | Hours / Minutes / Seconds | hrs / min / sec | hrs × 3,600 + min × 60 + sec | Compound durations containing hours, minutes, and seconds |
| Popular Units | Days / Hours / Minutes | days / hrs / min | days × 86,400 + hrs × 3,600 + min × 60 | Compound durations spanning days, hours, and minutes |
Example Calculation
Both durations are converted to seconds before the comparison is performed. This prevents different time units from affecting the mathematical relationship. The calculation keeps full internal precision and rounds only the displayed result when necessary. A percentage above 100% would also be valid if the first duration were longer than the second.
Reverse solving uses the same percentage relationship as the direct calculation. The known duration is normalized to seconds before the unknown duration is calculated. Full numerical precision is retained throughout the calculation and formatting occurs only for display. Any two valid values among T1, T2, and P can determine the remaining value.
Results are rounded for display.
Internal calculations use full precision.
Calculations Disclaimer
Why Time Percentage Matters When Raw Durations Feel Misleading
A schedule can look simple until two durations need comparison. Raw hours often hide the useful relationship. A Time Percentage Calculator turns that comparison into one clear percentage. The Time Percentage Calculator also removes manual conversion work. That matters when the two durations use different units.
A percentage gives context that a raw duration cannot provide. Three hours may look large or small. Its meaning depends on the reference duration. Three hours within four hours means something very different. Three hours within forty hours tells another story.
This makes time percentage useful for fast decisions. It helps users compare effort, progress, capacity, and time allocation.
The Core Problem: Two Durations That Look Hard to Compare
The hardest part is rarely the arithmetic itself. The real problem is choosing the correct reference duration.
Imagine a team records 90 minutes of downtime. The full monitoring period lasts six hours. The raw value alone gives limited context. A percentage shows the scale of that downtime immediately.
The same issue appears with work, study, media, and project tracking. Users often know both durations already. They simply need a clear relationship between them.
Mixed units make the task more confusing. One duration may use minutes. The other may use hours or days. Manual conversion creates another chance for error.
A good calculator removes that extra step. It keeps the comparison focused on meaning.
Quick view: two durations → common time scale → comparison → clear percentage.
That short path is important. Users should not solve unit problems before solving their real problem.
What the Percentage Tells You in One Glance
The result tells how large the first duration is relative to the second. This is a relative comparison, not just another time value.
A small percentage signals a small share of the reference duration. A large percentage signals a larger share. A result near 100 percent means both durations are similar.
A result above 100 percent is also possible. That result can surprise new users. It simply means the first duration exceeds the reference duration.
This becomes useful when plans change. Actual time may exceed planned time. Logged work may exceed an original time budget. A task may last longer than its target window.
The result shows that change without hiding it.
A Better Decision Signal Than Raw Time Alone
Raw time answers, “How long did this take?”
Time percentage answers, “How large is this compared with the reference?”
That second question often supports better decisions.
A project lead can spot an oversized task. A student can see uneven study allocation. A manager can review meeting load. A user can measure viewing or listening progress.
The percentage does not replace the original time values. It adds context to them.
That extra context is often the difference between data and insight.
How the Time Percentage Calculator Solves the Problem Instantly
A common calculator forces users into one fixed direction. That becomes frustrating when the unknown value changes.
Sometimes the percentage is unknown. Sometimes the first duration is unknown. Sometimes the second duration is missing.
This calculator supports all three situations. Any two valid main values can determine the remaining value.
That makes the workflow faster. It also reduces repeated manual rearrangement.
Enter Any Two Known Values and Let the Third Update
The calculator treats the three main values as connected.
You can enter both time durations. The percentage appears automatically.
You can also enter one duration and the percentage. The missing duration then becomes the calculated result.
This means the calculator is not built around one fixed output field. The calculated field can change as your task changes.
That detail is more useful than it first appears.
A project manager may know planned duration and completion percentage. The missing value is completed time.
Another user may know completed time and total time. The missing value is the percentage.
Both tasks belong to the same mathematical relationship. They should not require separate calculators.
The interface keeps these tasks together.
Why Reverse Solving Changes the User Experience
Reverse solving removes a common source of friction.
Without it, users must rearrange the relationship themselves. That may sound easy. In practice, mistakes happen quickly.
People may divide in the wrong direction. They may treat the percentage incorrectly. They may convert only one duration.
Reverse solving avoids those extra steps.
The benefit grows when the user is under time pressure. Fast planning often happens during meetings or active work. There may be little time for manual checking.
A responsive tool gives the missing value as soon as enough information exists.
That keeps attention on the decision.
Watch this: the value you thought was only an output can become an input.
That is the key interaction idea behind this calculator.
The Last Two Edited Values Stay in Control
A three-value calculator needs a clear rule. Otherwise, all three values could conflict.
The calculator uses the two most recently edited values as active inputs. The remaining value becomes the calculated one.
This creates predictable behavior.
Suppose two durations produce a percentage. You then change that percentage. The calculator keeps the other recent duration fixed. It solves the remaining duration again.
Change another field next. The calculation direction changes with your edit.
This interaction removes the need for mode switches. There is no separate forward or reverse calculator.
The workflow follows the user’s intent.
That makes repeated testing much faster. You can explore several scenarios without rebuilding the calculation each time.
How Mixed Time Units Are Compared Without Manual Conversion
A user often has two correct time values in different formats. One may be 45 minutes. Another may be two hours.
The comparison should still work.
Manually converting every input slows the process. It can also introduce mistakes. This becomes worse with longer units.
A practical calculator should handle that conversion automatically.
Compare Minutes, Hours, Days, Weeks, Months, and Years
The calculator supports common time scales for real tasks.
Short durations may use milliseconds or seconds. Everyday tasks often use minutes and hours. Longer periods may use days, weeks, months, or years.
The user can select the most natural unit for each duration.
That means a value does not need rewriting first.
A 90-minute task can remain 90 minutes. A two-hour reference can remain two hours.
The comparison still works because the calculator handles the internal conversion.
This is especially useful when data comes from different systems.
A timer may report seconds. A schedule may report hours. A project plan may use days.
Forcing every source into one visible unit adds unnecessary work.
The tool should do that work quietly.
Compound Time Inputs for Real-World Durations
Real durations are not always neat decimal values.
A user may have one hour and thirty minutes. Another duration may contain days, hours, and minutes.
Compound time inputs make these values easier to enter.
This avoids a common mistake with decimal time.
For example, one hour and thirty minutes should not be typed as 1.30 hours. Decimal hours use a different meaning.
Compound inputs preserve the way people naturally read time.
Hours, minutes, and seconds can stay separate. Days, hours, and minutes can also stay separate.
This matters when values come from clocks, logs, or reports.
It also reduces mental conversion.
Key point: enter time the way the source already shows it.
The calculator handles the rest.
Why a Common Base Keeps the Comparison Stable
Different unit labels should not change the underlying relationship.
The calculator first represents both durations on the same internal time scale. The comparison then uses those equivalent durations.
This keeps the result stable when units change.
Changing two hours into minutes should not change the meaning. The displayed number changes, but the physical duration remains identical.
That is the behavior users expect.
It also makes cross-unit comparisons reliable.
A user can switch units to improve readability. The calculation should remain the same.
This separation between display and meaning keeps the tool easy to trust.
Common Time Percentage Mistakes That Distort the Result
A wrong result often begins with a correct number used in the wrong way.
Time percentage has only a few moving parts. Yet several mistakes appear repeatedly.
Most are easy to prevent once users know where to look.
Confusing Decimal Hours with Hours and Minutes
This mistake can change a result without looking obviously wrong.
Clock-style time and decimal time are different systems.
One hour and thirty minutes equals one and a half hours. It does not equal 1.30 decimal hours.
The difference may seem small at first. It becomes important across many calculations.
The safest approach is simple.
Use compound time fields for clock-style durations. Use decimal values only when the source already uses decimals.
This keeps the entered duration faithful to the original record.
Reversing the Reference Duration by Accident
The order of the two durations matters.
The second duration acts as the reference. Changing that reference changes the meaning of the result.
Users sometimes swap the values and expect the same percentage. That will not happen.
The two directions answer different questions.
Ask one sentence before entering values:
“How large is the first duration compared with the second?”
That question usually reveals the correct order.
A small pause here can prevent a large interpretation error.
Why Results Above 100 Percent Can Be Correct
A result above 100 percent often looks suspicious.
It may actually be exactly right.
This happens when the first duration is longer than the reference duration.
Suppose actual time exceeds planned time. The first value is now larger. The resulting percentage must rise above 100 percent.
The calculator should not hide that result.
In many workflows, it is the most important signal.
A value above 100 percent may reveal an overrun. It may show extra effort. It may reveal a longer-than-expected process.
The meaning depends on the context.
The mathematics simply reports the relationship.
Deleting a Calculated Field Without Clearing the Calculator
Another surprise appears during editing.
A user may delete one value. The value then appears again.
This happens when the other two values remain valid. The deleted field has become the unknown value. The calculator can solve it immediately.
That behavior is intentional.
It keeps the relationship complete while two usable inputs remain.
Users who want a fresh start should clear the whole calculation.
This is faster than deleting fields one by one.
Fast check: if two valid values remain, the third can return automatically.
Once users know this rule, the interaction becomes predictable.
Practical Uses for Work, Projects, Study, and Daily Planning
Raw time logs can become difficult to compare.
A list of minutes and hours shows activity. It does not always show priority.
Percentage-based views help reveal where time is going.
That can support better planning without adding complex reports.
Measure Work Allocation Without Spreadsheets
A workday may contain meetings, support tasks, focused work, and administration.
Each category has a duration. Those values become easier to compare as shares.
This can reveal an unexpected imbalance.
A manager may discover that meetings take more time than expected. A freelancer may compare billable time against a chosen work period.
The calculation itself stays simple.
The important part is choosing a meaningful reference duration.
The same reference should be used when comparing categories.
That keeps the results easy to interpret.
Track Project Time Against a Planned Window
Projects often fail slowly before they fail visibly.
Small delays collect across many tasks. Raw time records may hide that pattern.
A percentage can make an overrun easier to notice.
Teams can compare consumed time with a planned time window. They can also compare individual task durations with larger project periods.
This creates a quick warning signal.
Text infographic: plan → track → compare → notice change → act.
That sequence is useful because the percentage does not need a large dashboard.
It can provide a fast check during active work.
Spot Overruns Before They Become Expensive
A task that consumes too much planned time deserves attention.
The percentage does not explain why the overrun happened. It tells you where to investigate.
That distinction matters.
A high value may reflect poor planning. It may reflect an unexpected problem. It may also reflect a justified scope change.
The result is a signal, not a diagnosis.
Use it to ask better questions earlier.
Early questions are usually cheaper than late corrections.
Compare Study, Training, and Practice Sessions
Study plans often fail because time feels evenly distributed.
The numbers may tell a different story.
A learner can compare one subject’s study time with the total study period.
An athlete can compare one training block with a full session.
A musician can compare focused practice with total practice time.
These comparisons reveal allocation patterns.
They can also help users adjust future plans.
A low share is not automatically bad. A high share is not automatically good.
The value only becomes useful when tied to a goal.
That is why context should guide every interpretation.
Review Media, Exercise, and Personal Time
The same method works outside formal planning.
Users can track how much of a video they have watched. They can measure listening progress. They can compare exercise blocks within a longer session.
Personal schedules can also benefit.
A user may want to know how much time goes to commuting. Another may compare rest time against active time.
These tasks share the same basic need.
Two durations exist. The user wants their relative size.
That makes the calculator useful across many everyday situations.
How to Read the Result Without Overthinking It
A percentage can look precise while still being misunderstood.
The number itself is only half the answer. The other half is the question being asked.
The same percentage can describe progress, allocation, delay, or comparison.
That is why interpretation should stay tied to context.
Use the Percentage as a Relative Comparison
Start with the simplest reading.
The percentage describes the first duration relative to the second duration.
A lower result means the first duration is smaller. A result near 100 percent means both are similar. A higher result means the first duration is larger.
That reading remains stable across most use cases.
Problems begin when users attach another meaning automatically.
For example, a time percentage is not always efficiency. It is not always productivity. It is not always completion.
Those terms may use special definitions.
A company may define utilization differently. A project may define completion through milestones instead of time.
The calculator should answer the duration question first.
The user can then apply that result to the correct context.
This simple separation prevents many reporting mistakes.
Curiosity check: two teams can report the same percentage and mean different things.
The reason is not mathematics. The reason is the chosen reference.
AxiCalculator keeps the numerical comparison direct. You control the business meaning.
Use the calculator when you need a fast duration comparison. Enter any two known values. Review the calculated third value. Then check whether your chosen reference matches the decision.
That short workflow keeps the result useful.
It also makes repeated scenario testing easy.
When the question changes, edit the value that changed. The calculator responds immediately.
Use the number as a clear signal. Keep the context beside it. Then make the decision with less guesswork.
Frequently Asked Questions
What does a time percentage actually tell me about two durations?
Why does changing the selected time unit not change the percentage result?
When should I use compound time instead of decimal hours?
Can I use a target percentage to estimate a missing future duration?
How should an engineer calculate machine downtime percentage across a production shift?
Can the time percentage result be used directly as machine efficiency or performance?
What should I check when a reverse-solved duration looks technically incorrect?
Our engineers are here to help you get it right.