Percent Error Calculator
- Last formula update:
Decimal & Rounding Policy
- Decimal values are accepted for both true and observed values.
- Calculations use full numerical precision without rounding intermediate values.
- Only the displayed result may be rounded for clearer presentation.
- Negative, positive, and zero percent error results preserve their correct mathematical sign.
- Reverse calculations also use unrounded values to maintain maximum accuracy.
Valid range
- True value (T): must be a finite number greater than 0.
- Observed value (O): must be a finite number greater than 0.
- Percent error (E): valid finite results are greater than -100%, with no fixed positive upper limit.
- An error of -100% makes reverse calculation of the true value undefined because the denominator becomes zero.
- Values below -100% are not valid when solving for positive true or observed values.

Cerelia Daxbourne
Reviewers:
Melovia Pexford
Iskren Lumthorne
Check our editorial policy
August 29, 2026
1.0.0
Initial calculator and formula release.
Our engineers are here to help you get it right.
How Does the Percent Error Calculator Help You Check Measurement Accuracy?
Percent Error Calculator quickly compares an observed value with a true reference value and shows both the size and direction of the deviation. It uses a signed calculation, so positive and negative results remain meaningful instead of being converted automatically to absolute values.
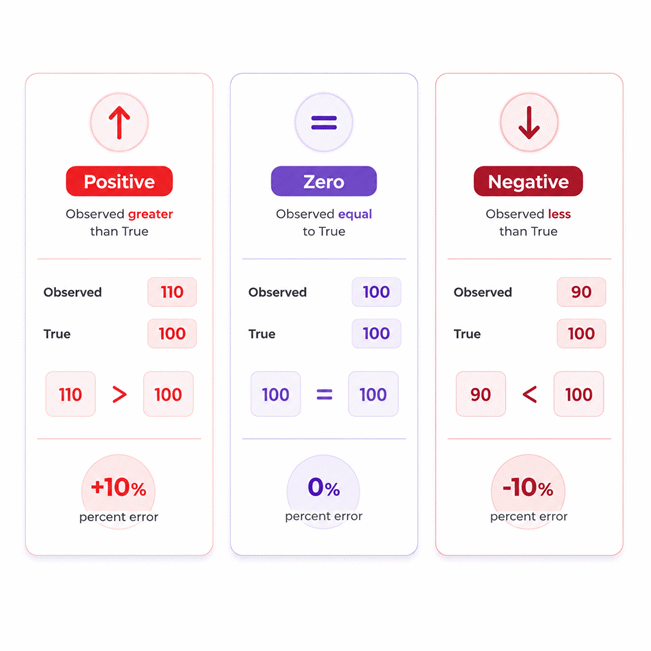
- A positive percent error means the observed value is above the true value.
- A negative percent error means the observed value is below the true value.
- Zero percent error means the observed and true values are equal.
- The calculator can solve percent error from true and observed values.
- Reverse solving can recover the true value or observed value when missing.
- Percent error measures relative deviation, not the raw numerical difference alone.
- A small reference value can make a modest difference produce a large percentage.
- A true value of zero prevents the standard percent error calculation.
- Signed results can help reveal repeated overestimation or underestimation patterns.
The Percent Error Calculator is useful for laboratory work, engineering checks, calibration screening, education, and general measurement analysis. It provides the mathematical comparison instantly, while the final interpretation should still consider the reference quality, measurement process, equipment condition, and application requirements.
Assumptions used in this calculator
- True value is assumed to be positive, finite, and correctly identified.
- Observed value is assumed to represent the same quantity as true value.
- True and observed values are assumed to use compatible measurement units.
- Input values are assumed to come from reliable measurements or accepted references.
- Percent error preserves direction and is not converted to absolute magnitude.
- Positive error indicates the observed value exceeds the true value.
- Negative error indicates the observed value is below the true value.
- Intermediate calculations retain full precision before any display rounding is applied.
- Results depend entirely on the accuracy and validity of entered values.
- Reverse calculations assume the selected known values are mathematically consistent.
- A -100% error creates a zero denominator in true-value reverse calculation.
- Industrial decisions should verify source data, tolerances, calibration, and instrument condition.
- Calculator results should be independently checked before safety-critical or compliance decisions.
Results are rounded for display.
Internal calculations use full precision.
Formulas Used in Percent Error Calculator :
Percent Error Formula
Observed Value Formula
True Value Formula
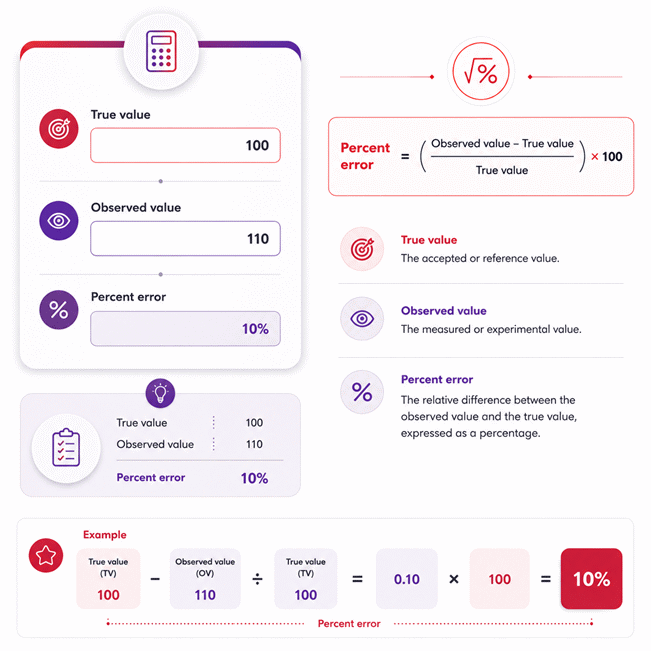
- E = percent error, expressed as a percentage.
- O = observed or measured value.
- T = true, theoretical, or accepted value.
The observed and true values must represent the same quantity in compatible units. The calculator preserves the sign of the error: a positive result means the observed value is above the true value, while a negative result means it is below the true value. When one value is unknown, the same relationship is rearranged algebraically for reverse solving. Calculations use full internal precision, and rounding is applied only to the displayed result.
Variables & Definitions
View a complete list of all variables used in this calculator, including definitions and units
Percent Error Calculator Variables and Definitions
| Variable | Symbol | Definition | Calculator Role | Valid Range | Unit |
|---|---|---|---|---|---|
| True value | T | The true, theoretical, or accepted value used as the reference. | Manual input or automatically calculated value. | Finite value greater than 0. | Same compatible unit as the observed value. |
| Observed value | O | The observed, measured, or experimental value being compared with the true value. | Manual input or automatically calculated value. | Finite value greater than 0. | Same compatible unit as the true value. |
| Percent error | E | The signed relative difference between the observed value and the true value. | Manual input or automatically calculated percentage. | Greater than -100% for valid positive true and observed values, with no fixed positive upper limit. | % |
Unit Conversion Table
Percent Error Unit Conversion Table
| Unit Group | Unit Name | Symbol | Equivalent in Decimal | Used For |
|---|---|---|---|---|
| Dimensionless | Percent | % | 1% = 0.01 | Standard percent error output |
| Dimensionless | Decimal | - | 1 = 1 | Internal relative-error calculations |
| Dimensionless | Basis Point | bp | 1 bp = 0.0001 | Small relative differences |
| Dimensionless | Parts Per Million | ppm | 1 ppm = 0.000001 | High-precision measurement error |
Length Unit Conversion Table
| Unit Group | Unit Name | Symbol | Equivalent in Meter | Used For |
|---|---|---|---|---|
| Length | Millimeter | mm | 0.001 m | Precision dimensions and machining |
| Length | Centimeter | cm | 0.01 m | Small dimensional measurements |
| Length | Meter | m | 1 m | SI length measurements |
| Length | Kilometer | km | 1000 m | Long-distance measurements |
| Length | Inch | in | 0.0254 m | Imperial engineering dimensions |
| Length | Foot | ft | 0.3048 m | Imperial dimensional measurements |
Mass Unit Conversion Table
| Unit Group | Unit Name | Symbol | Equivalent in Kilogram | Used For |
|---|---|---|---|---|
| Mass | Milligram | mg | 0.000001 kg | Laboratory and precision measurements |
| Mass | Gram | g | 0.001 kg | Small mass measurements |
| Mass | Kilogram | kg | 1 kg | SI mass measurements |
| Mass | Ounce | oz | 0.028349523125 kg | Imperial mass measurements |
| Mass | Pound | lb | 0.45359237 kg | Industrial and imperial measurements |
Pressure Unit Conversion Table
| Unit Group | Unit Name | Symbol | Equivalent in Pascal | Used For |
|---|---|---|---|---|
| Pressure | Pascal | Pa | 1 Pa | SI pressure measurements |
| Pressure | Kilopascal | kPa | 1000 Pa | Process and pneumatic measurements |
| Pressure | Megapascal | MPa | 1000000 Pa | High-pressure industrial measurements |
| Pressure | Bar | bar | 100000 Pa | Industrial pressure systems |
| Pressure | Pound per Square Inch | psi | 6894.757293 Pa | Imperial pressure measurements |
Temperature Unit Conversion Table
| Unit Group | Unit Name | Symbol | Equivalent in Celsius | Used For |
|---|---|---|---|---|
| Temperature | Degree Celsius | °C | °C = °C | Industrial and scientific temperature measurements |
| Temperature | Degree Fahrenheit | °F | °C = (°F - 32) × 5 / 9 | Imperial temperature measurements |
| Temperature | Kelvin | K | °C = K - 273.15 | Scientific and thermodynamic measurements |
| Temperature | Degree Rankine | °R | °C = (°R - 491.67) × 5 / 9 | Engineering thermodynamic measurements |
Speed Unit Conversion Table
| Unit Group | Unit Name | Symbol | Equivalent in Meters per Second | Used For |
|---|---|---|---|---|
| Speed | Meter per Second | m/s | 1 m/s | SI velocity measurements |
| Speed | Kilometer per Hour | km/h | 0.277777778 m/s | General speed measurements |
| Speed | Foot per Second | ft/s | 0.3048 m/s | Imperial engineering measurements |
| Speed | Mile per Hour | mph | 0.44704 m/s | Imperial speed measurements |
| Speed | Knot | kn | 0.514444444 m/s | Marine and aviation measurements |
Example Calculation
The observed value is 6.42 units higher than the true value. Dividing this difference by the true value gives a relative error of 0.05. Multiplying by 100 converts the relative error to 5%. Because the observed value is higher than the true value, the percent error remains positive.
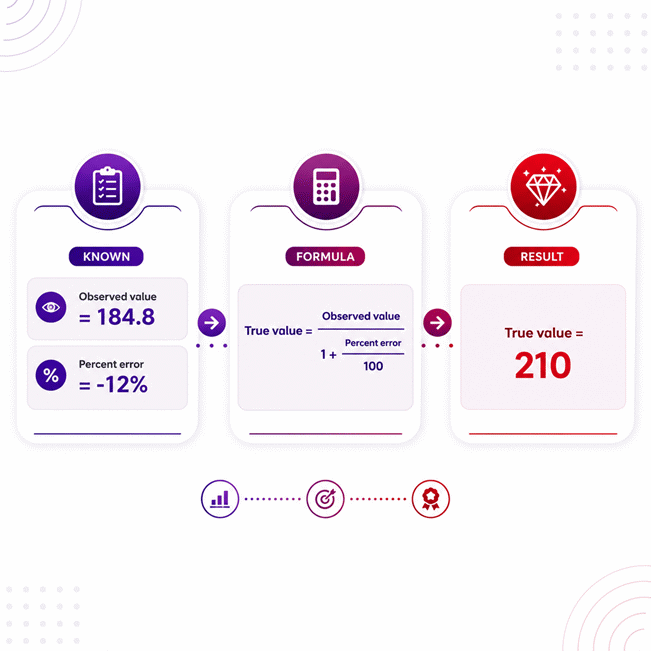
The observed value and percent error are known, so the true value becomes the unknown variable. A percent error of -12% means the observed value is 12% below the true value. Dividing 184.8 by 0.88 reconstructs the original true value of 210. The negative sign is preserved because this calculator uses signed percent error.
Results are rounded for display.
Internal calculations use full precision.
Calculations Disclaimer
What Is Percent Error and What Does It Reveal About Measurement Accuracy?
A measurement can look correct while still hiding a useful difference. Percent error shows that difference relative to a reference value. This makes the result easier to compare across different measurement sizes. A raw difference of five units may be small or large. The reference value decides which interpretation is correct.
A Percent Error Calculator makes this comparison fast and consistent. It compares an observed value with a true value. The result shows the size and direction of the deviation. This calculator keeps that direction instead of hiding it. That detail can reveal information a positive-only result may conceal.
A positive result means the observation sits above the reference. A negative result means it sits below the reference. A zero result means both values match exactly. These three outcomes can support faster measurement checks. They also help users spot patterns across repeated observations.
Observed below reference → negative error → possible underestimation
Observed equals reference → zero error → no numerical deviation
Why the Reference Value Matters More Than It First Appears
The biggest mistake often happens before any calculation begins. A user may choose the wrong reference value. That choice changes the meaning of every later result. Percent error is not simply the difference between two numbers. It measures one value relative to a chosen baseline.
The reference may come from an accepted target or trusted measurement. It may also come from a theoretical result. The observed value is the value being checked. Switching these roles changes both the ratio and the interpretation. That is why correct value selection matters so much.
Why Direction Can Reveal More Than Magnitude Alone
Two measurements can have equal error sizes but opposite meanings. One may be five percent high. Another may be five percent low. Removing the sign makes those cases look identical. Keeping the sign preserves useful direction.
This is especially helpful during repeated measurement checks. Repeated positive results may suggest a consistent upward shift. Repeated negative results may suggest the opposite trend. One result cannot prove the cause. Still, direction can show where deeper checks should begin.
How Does the Percent Error Calculation Work?
A common problem starts with two values that look very close. The eye may underestimate their relative difference. Percent error solves this by scaling the difference against the reference. The result becomes a percentage that is easier to interpret.
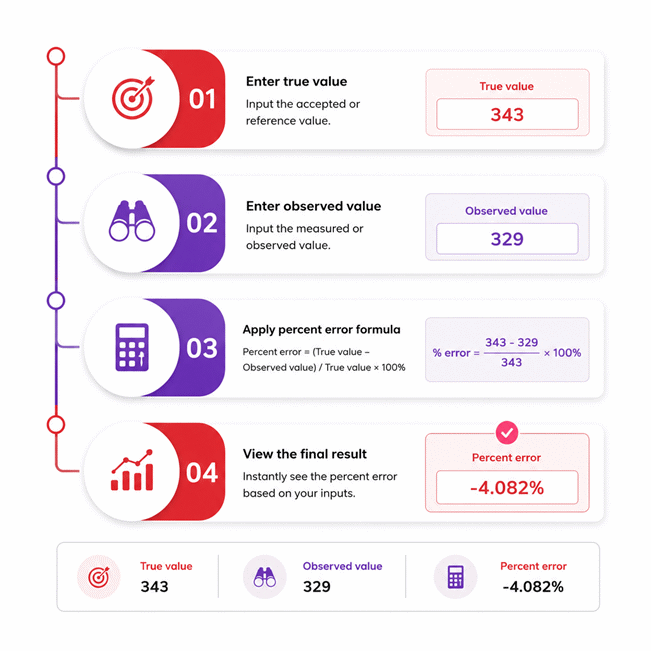
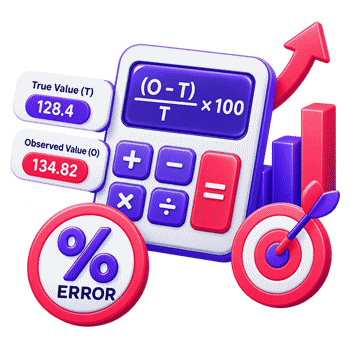
The calculation starts by subtracting the true value from the observed value. The difference is then divided by the true value. Finally, the ratio is multiplied by one hundred. This calculator keeps the mathematical sign throughout that process.
The structure looks simple, but the denominator controls the meaning. The difference is judged against the reference itself. This is why the same raw difference can produce different percentages. A ten-unit gap is not always a ten-percent error.
What Happens When the Observed Value Is Higher?
A higher observed value creates a positive numerator. The final percentage is therefore positive when the reference is positive. This tells you that the observation exceeds the reference. It does not automatically explain why that happened.
A positive error may come from measurement bias or process drift. It may also come from normal variation. The number shows direction and relative size. It does not identify the root cause by itself.
What Happens When the Observed Value Is Lower?
A lower observed value creates a negative numerator. The final percentage therefore carries a negative sign. That sign means the observation falls below the reference value.
This can be useful during repeated checks. Several negative results may reveal a pattern worth investigating. A single negative result may simply reflect normal variation. The calculation gives evidence, not a diagnosis.
How Does Reverse Percent Error Solving Work?
A missing reference value can stop a normal calculator immediately. A reverse solver removes that obstacle. It can calculate the missing value from the other two known values. This turns the tool into more than a one-way percentage calculator.
The key idea is simple. The original mathematical relationship does not change. The equation is only rearranged for the unknown quantity. AxiCalculator can therefore solve different directions without changing the measurement model.
Know true value + percent error → solve observed value
Know observed value + percent error → solve true value
How to Recover the True Value From Percent Error
A difficult situation appears when the reference value is missing. You may know the observation and signed error instead. The original relationship can be rearranged to isolate the reference.
This reverse calculation can save several manual algebra steps. It also reduces the risk of rearranging the equation incorrectly. The percent error sign still matters. A negative error changes the denominator differently from a positive error.
How to Recover the Observed Value From Percent Error
Sometimes the measured value is missing instead. You may only know the reference and percent error. The same relationship can be rearranged for the observation.
This form has a useful interpretation. A positive percentage increases the reference value. A negative percentage reduces it. That relationship makes reverse results easier to check mentally.
Why the -100% Boundary Deserves Special Attention
One value creates an immediate mathematical warning. At -100%, the reverse true-value denominator becomes zero. Division by zero has no finite result. This is not a software defect. It is a direct mathematical consequence.
This boundary becomes important when reverse solving. Results close to that point can also change very quickly. Users should inspect such cases carefully before drawing conclusions.
Signed Percent Error vs Absolute Percent Error
A common source of confusion appears when two calculators show different signs. One may show a negative result. Another may show only a positive magnitude. Both may be applying different conventions.
A magnitude-only method removes the sign after subtraction. That approach answers one simple question. It tells you how far the observation sits from the reference. A signed method answers an extra question. It also tells you which side of the reference contains the observation.
This calculator preserves the sign. That choice supports directional interpretation. It is useful when overestimation and underestimation have different meanings. The sign can also help reveal repeated measurement bias.
When Does the Signed Method Provide More Insight?
A process can appear stable while slowly drifting in one direction. Magnitude-only results may hide that pattern. Signed values keep the direction visible. This makes a sequence easier to inspect.
Imagine several checks with similar error sizes. All results remain slightly positive. That pattern is more informative than repeated unsigned percentages. It may justify checking the measurement chain. It may also justify inspecting the reference process.
The signed result should still be interpreted with context. Direction alone cannot prove sensor drift. It cannot prove calibration failure either. It is a signal that helps guide the next check.
Percent Error and Related Error Measures Are Not Interchangeable
A serious mistake occurs when every percentage comparison gets called percent error. Similar names often describe different mathematical questions. Choosing the wrong measure can create a convincing but misleading result.
Percent error compares an observation with a reference. Percent difference usually compares two values without a preferred reference. Relative error expresses a difference as a ratio. Absolute error reports the raw numerical gap.
The right choice depends on the question being asked. If one value is the accepted baseline, percent error is useful. If neither value is the baseline, percent difference may fit better.
Percent Error vs Percent Difference
Two measurements may deserve equal status. In that case, calling one the true value may be misleading. Percent difference avoids that assumption by using both values symmetrically.
Percent error behaves differently. One value is treated as the baseline. This gives the denominator a clear meaning. Using percent error without a valid baseline can distort interpretation.
Percent Error vs Relative and Absolute Error
A raw error can look dramatic until scale enters the picture. Absolute error reports only the numerical gap. Relative error compares that gap with the reference. Percent error expresses that relative relationship as a percentage.
These measures answer related questions, but not identical ones. Absolute error is useful when units matter directly. Percent error is useful when proportional deviation matters more.
Why Can Percent Error Become Surprisingly Large?
A small numerical difference can sometimes create a large percentage. This often surprises new users. The cause usually sits in the denominator, not the subtraction.
When the reference value is small, the same difference becomes large relative to it. The percentage therefore grows quickly. This does not mean the calculator has amplified the data incorrectly. It means the deviation is large compared with the baseline.
This effect matters when users compare measurements of very different scales. A fixed raw difference has different importance across those scales. Percent error makes that proportional change visible.
What Happens When the Reference Approaches Zero?
The calculation becomes more sensitive as the reference gets very small. A tiny denominator can create a very large ratio. This can make interpretation difficult even when the arithmetic is correct.
The problem becomes complete when the reference reaches zero. The main calculation would require division by zero. The percentage is then not defined in the usual mathematical sense.
Can Percent Error Be Greater Than 100%?
A result above 100% may look impossible at first. It is mathematically possible. The observed value can differ from the reference by more than the reference itself.
For a positive reference, a very high observation can exceed this threshold. The result simply shows a large relative deviation. It does not create a mathematical contradiction.
Common Percent Error Mistakes Can Produce Convincing Wrong Results
The most dangerous error often looks perfectly reasonable. A calculator can produce a clean percentage from incorrect inputs. The arithmetic may be flawless while the interpretation is wrong.
Common mistakes include reversing the value roles. Users may also confuse percent error with percent difference. Another mistake is removing the negative sign without considering its meaning.
Users should first decide which value acts as the reference. They should then confirm what the final percentage needs to represent. This short check prevents many avoidable mistakes.
Why Choosing the Wrong Baseline Changes Everything
A familiar value can feel like the obvious denominator. That instinct may be wrong. The denominator represents the reference value in this method.
Changing the denominator changes the scale of the error. The final percentage therefore changes too. This is not a minor formatting issue. It changes the mathematical question being answered.
Why Sign Confusion Can Hide Useful Information
A negative answer often triggers an immediate urge to remove the sign. That reaction can erase valuable information. The negative sign shows that the observation is below the reference.
If direction matters, the sign should remain visible. This can help during calibration checks and process reviews. It also helps distinguish upward and downward deviation.
How Percent Error Supports Scientific and Engineering Decisions
A single measurement rarely tells the entire story. Engineers often need a fast first check before deeper analysis. Percent error can provide that first comparison.
It is useful when a measured result is compared with a reference. The result quickly shows relative deviation. The signed form also shows whether the reading is high or low.
This can support laboratory checks and equipment verification. It can also support process monitoring and quality reviews. The calculation remains simple enough for rapid use.
Yet the result should stay in context. Measurement systems can include bias and repeatability effects. Environmental conditions can also influence readings. Percent error helps identify deviation, but it does not explain every cause.
How Signed Error Can Support Calibration Screening
A sensor may appear normal while slowly moving away from reference values. Repeated signed results can make that direction easier to see. A consistent positive pattern may deserve attention.
A consistent negative pattern may deserve the same attention. Neither pattern proves the cause. Both patterns can guide a more focused investigation.
This makes the calculator useful as a screening tool. It helps identify measurements that deserve closer review. It should support technical judgment rather than replace it.
How Percent Error Can Help With Process Monitoring
A production process can drift before failure becomes obvious. Comparing measurements with reference targets can reveal that movement earlier. Percent error gives the difference a common scale.
This becomes useful when measurements have different numeric sizes. Percentages can make relative deviations easier to compare. Direction can add another layer of insight.
How Should You Interpret a Percent Error Result Before Acting?
A number can feel decisive because it looks precise. That confidence can be dangerous without context. A percentage should support a decision, not replace the reasoning behind it.
Start by asking what the reference represents. Then inspect the sign and size. Next, consider whether the deviation makes sense for the process. A surprising result deserves verification before action.
A very small error can still matter in a strict process. A larger error may be acceptable elsewhere. There is no universal threshold that fits every application.
For fast checks, AxiCalculator provides the numerical relationship immediately. The user can then focus on interpretation instead of manual algebra. Reverse solving also helps when one quantity is missing.
What Can a Percent Error Result Actually Prove?
A single percentage cannot prove that equipment is faulty. It cannot identify every source of measurement error. It also cannot separate random variation from systematic bias alone.
What it can prove is narrower and more useful. It quantifies the relative difference from the chosen reference. In signed form, it also identifies direction.
This makes the result a strong starting point. It can trigger another measurement or technical inspection. It can also support documentation during a review.
When Should a Simple Error Check Lead to Deeper Analysis?
A surprising result deserves more attention when decisions carry higher risk. Repeated deviation is another reason to investigate. Sudden changes can also signal a process problem.
In those cases, review the full measurement system. Check the reference source and measurement method. Inspect equipment condition and environmental effects. Compare several observations rather than relying on one value.
The best measurement decisions combine fast calculations with careful judgment. A Percent Error Calculator handles the arithmetic quickly. The user remains responsible for interpreting what that arithmetic means.
Frequently Asked Questions
Should I calculate percent error for each trial or only after averaging repeated measurements?
Can I use percent error when a specification gives a tolerance band instead of one exact target value?
What should I do if the accepted or reference value is revised after I already calculated the error?
Can I compare percent error results from different experiments or measurement systems directly?
For a multi-point sensor calibration, should I rely on one percent error value for the entire measurement span?
How should percent error be documented in a professional calibration or validation record?
Can reverse solving be used to reconstruct a missing reference or observed value from archived process data?
Our engineers are here to help you get it right.