Birthday Paradox Calculator
- Last formula update:

Decimal & Rounding Policy
- All intermediate probability calculations retain full available numerical precision.
- Number of people and number of pairs are always displayed as whole integers.
- Birthday-sharing probabilities may be displayed with up to eight decimal places.
- Percentage and decimal probability conversions preserve the underlying probability value.
- Rounding is applied only to displayed results, never to intermediate calculations.
- A displayed 100% may result from rounding before mathematical certainty is reached.
- Exact certainty follows the selected 365-day or 365.25-day calendar model.
Valid range
- Number of people: whole numbers from 1 to 10000000 are supported.
- Number of pairs: whole numbers from 0 to 49999995000000 are supported.
- Pair inputs must correspond exactly to a valid whole-number group size.
- Probability in percent form: values from 0% through 100% are valid.
- Probability in decimal form: values from 0 through 1 are valid.
- Days in a year: select either 365 days or the 365.25-day averaged model.
- Fractional, negative, non-finite, or unsupported count values are invalid.

Wylena Brantford
Reviewers:
Valdren Clyforde
Zenara Dentwick
Check our editorial policy
September 20, 2026
1.0.0
Initial calculator and formula release.
Our engineers are here to help you get it right.
How Does the Birthday Paradox Calculator Reveal Shared-Birthday Odds So Quickly?
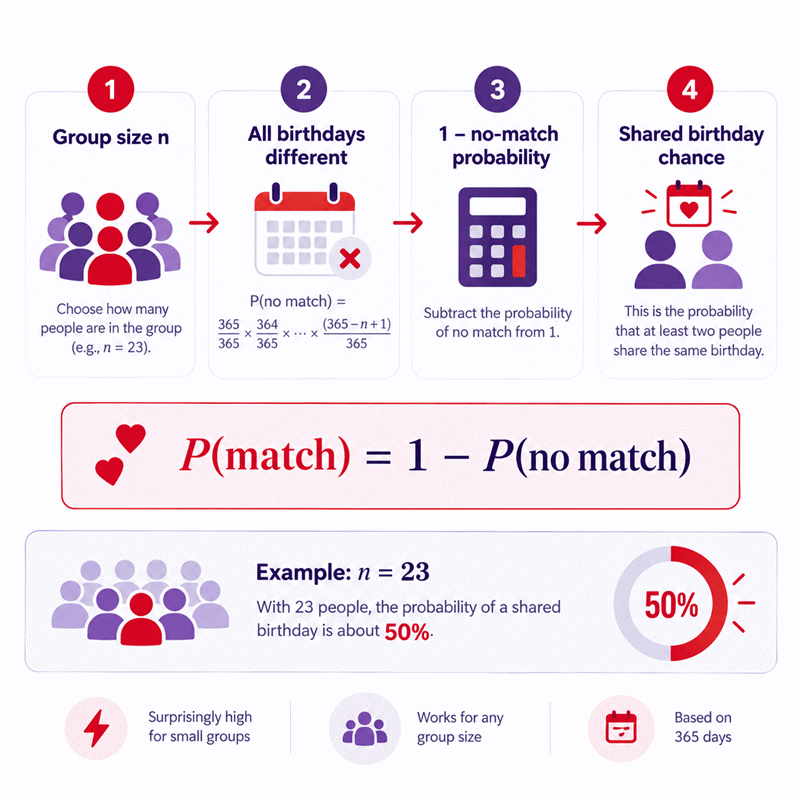
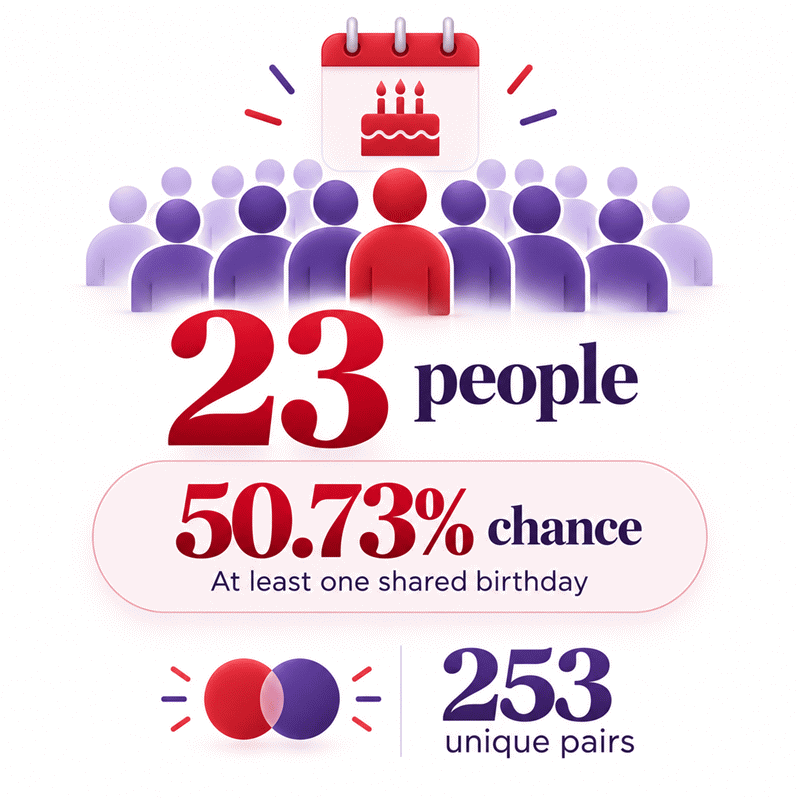
Birthday Paradox Calculator results become surprising long before a group feels large. With the classic 365-day model, only 23 people are needed to push the probability of at least one shared birthday above 50%. The reason is pair growth: 23 people create 253 unique person-to-person comparisons.
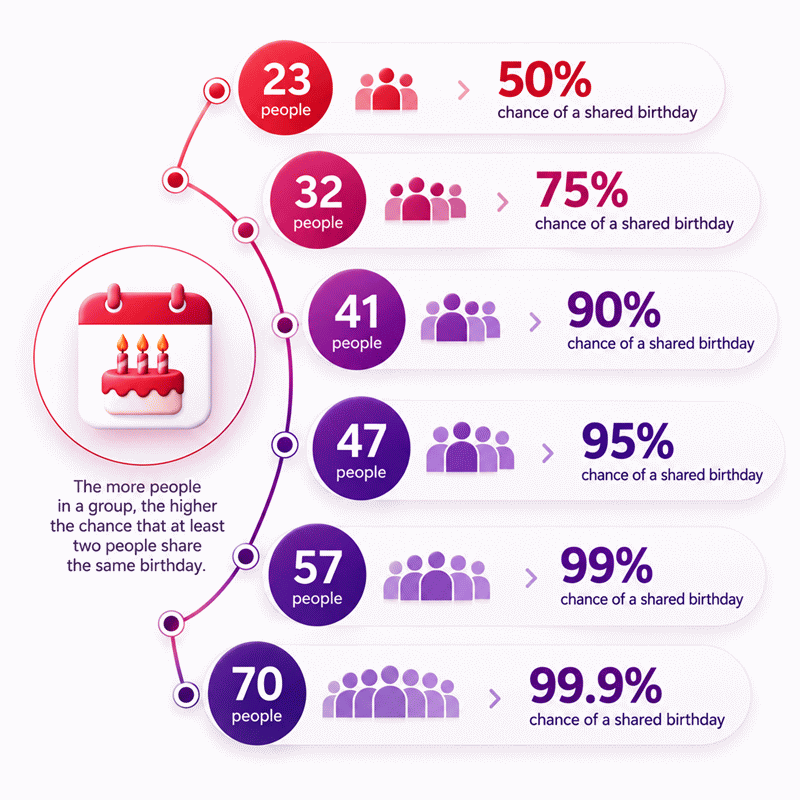
- 23 people produce about a 50.73% shared-birthday probability.
- 32 people exceed 75%, while 41 people exceed 90%.
- 47 people exceed 95%, and 57 people exceed 99%.
- 70 people push the probability beyond 99.9%.
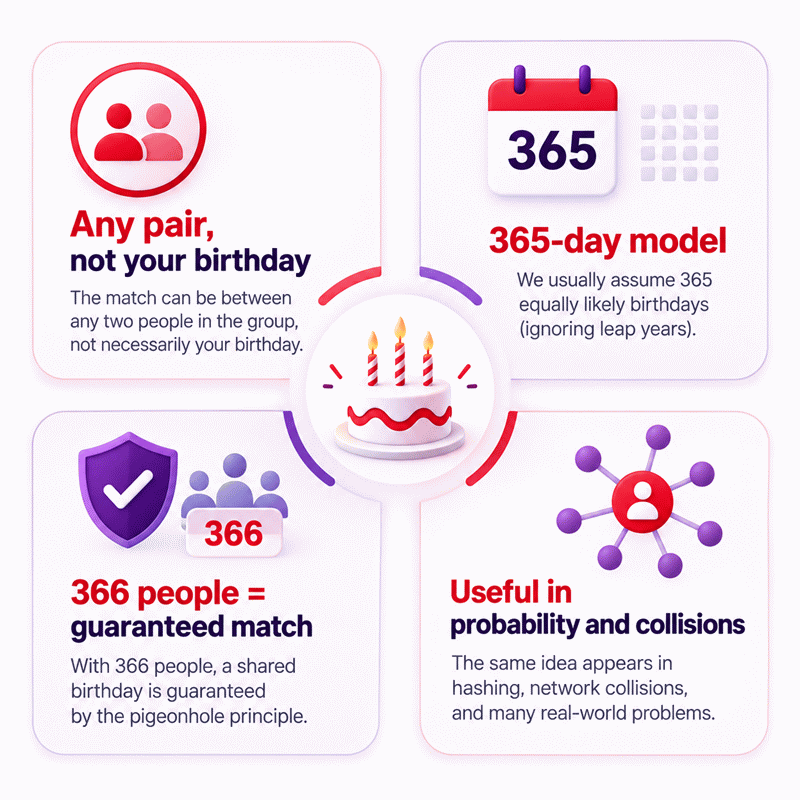
- The result concerns any matching pair, not one specified birthday.
- Reverse solving finds the smallest whole group meeting a probability target.
- The 365-day and 365.25-day settings produce slightly different results.
- Real birthday distributions can differ from the simplified theoretical model.
The Birthday Paradox Calculator from AxiCalculator lets you explore these thresholds in both directions. Change the group size to inspect probability, or begin with a target probability to find the minimum required group. The clearest insight is simple: collision opportunities grow much faster than headcount, which is why shared birthdays become likely so unexpectedly early.
Assumptions used in this calculator
- Birthdays are treated as independent observations within the selected calendar model.
- Each eligible calendar day is assumed equally likely for a birthday.
- Standard calculations use 365 possible birthday dates.
- Leap-year mode uses an average calendar length of 365.25 days.
- February 29 is represented through the averaged leap-year setting.
- Twins and intentionally dependent birthdays are not modeled separately.
- The calculation concerns at least one shared birthday within the group.
- People counts are whole numbers and cannot be fractional.
- Pair counts must correspond to a valid whole-number group size.
- Probability targets represent minimum thresholds in reverse solving.
- Reverse solving returns the smallest group meeting the requested probability.
- Intermediate probability calculations retain full available numerical precision.
- Displayed percentages may be rounded without changing the underlying calculation.
Results are rounded for display.
Internal calculations use full precision.
Formulas Used in Birthday Paradox Calculator :
1. Number of Unique Pairs
2. Probability That All Birthdays Are Different
3. Probability of at Least One Shared Birthday
4. Reverse Solving From Number of Pairs
5. Reverse Solving From a Target Probability
Variables
- n = number of people in the group.
- C = number of unique person-to-person pairs.
- d = selected calendar length in days.
- k = integer product index from 0 through n - 1.
- q = probability that every birthday is different.
- p = probability that at least two birthdays match.
- pt = requested target probability.
- nmin = smallest whole-number group meeting the target.
Variables & Definitions
View a complete list of all variables used in this calculator, including definitions and units
Birthday Paradox Calculator Variables and Symbols
| Variable | Name | Meaning | Valid Form | Role in Calculation |
|---|---|---|---|---|
n |
Number of people | Total people included in the birthday comparison. | Positive whole number | Determines pair count and birthday-match probability. |
C |
Number of pairs | Total unique person-to-person comparisons in the group. | Nonnegative triangular whole number | Calculated from n or used to reverse-solve n. |
d |
Calendar length | Number of possible birthday-day positions in the selected model. | 365 or 365.25 days | Defines the birthday sample space. |
k |
Product index | Counts previously occupied birthday positions during probability multiplication. | Integer from 0 to n - 1 | Builds the no-match probability product. |
q |
No-match probability | Probability that every person has a different birthday. | 0 to 1 | Complement used to obtain the shared-birthday probability. |
p |
Shared-birthday probability | Probability that at least two people share a birthday. | 0 to 1 | Primary probability result. |
pt |
Target probability | User-entered probability threshold for reverse solving. | 0 to 1 | Defines the required minimum probability. |
nmin |
Minimum required people | Smallest whole group size meeting the target probability. | Positive whole number | Final result in reverse probability mode. |
Unit Conversion Table
Birthday Paradox Calculator Unit Conversion and Reference Table
| Unit Group | Unit Name | Symbol | Equivalent / Reference | Used For |
|---|---|---|---|---|
| Probability | Percent | % | 1% = 0.01 decimal | Readable shared-birthday probability input and result |
| Probability | Decimal Probability | decimal | 1.00 = 100% | Scientific and mathematical probability representation |
| Probability | Quarter Probability | % / decimal | 25% = 0.25 | Reverse-solving probability threshold |
| Probability | Half Probability | % / decimal | 50% = 0.50 | Classic birthday probability threshold |
| Probability | Three-Quarter Probability | % / decimal | 75% = 0.75 | Reverse-solving probability threshold |
| Probability | Full Probability | % / decimal | 100% = 1.00 | Upper probability boundary |
| Discrete Count | Person | person | 1 person = 1 person | Group size used in the birthday calculation |
| Discrete Count | Pair | pair | 1 pair = 1 unique pair | Unique person-to-person birthday comparisons |
| Calendar Model | Standard Year | day | 365 days | Birthday probability without leap-year averaging |
| Calendar Model | Leap-Year Average | day | 365.25 days | Birthday probability with averaged leap-year adjustment |
Example Calculation
Days in a year = 365
A group of 34 people creates 561 unique birthday comparisons. The calculation first finds the probability that every birthday is different. That no-match probability is then subtracted from 1. The resulting chance of at least one shared birthday is about 79.53%.
Days in a year = 365
Thirty-four people do not reach the requested 80% threshold. Thirty-five people produce an exact probability of about 81.44%. Therefore, 35 is the smallest valid whole-number group for this target. That group contains 595 unique person-to-person birthday comparisons.
Results are rounded for display.
Internal calculations use full precision.
Calculations Disclaimer
Why Can Just 23 People Push Shared Birthday Odds Above 50%?
A small meeting can create a result that feels impossible. Twenty-three people seem tiny beside 365 calendar days. Yet the Birthday Paradox Calculator shows a probability above 50%. The Birthday Paradox Calculator is not comparing 23 people with 365 dates. It is tracking possible matches among the people themselves. That distinction changes everything. Each new person can match everyone already present. The opportunities for a match therefore grow much faster than headcount. A room does not need to fill half the calendar. It only needs enough overlapping pair opportunities. At 23 people, there are 253 unique pairs. Each pair is another chance for two dates to coincide. Most people do not naturally count those pairs. They picture one person looking for a matching birthday. That is a different question. This is why the result creates surprise. The mathematics is not strange. Human intuition is using the wrong comparison. The threshold is also easy to verify. Twenty-two people remain below a 50% chance. Twenty-three people move just above it. That sharp crossover makes 23 memorable. The lesson extends beyond birthdays. Whenever many items enter a limited outcome space, collisions can appear early. The important question becomes how many possible comparisons exist. That idea matters in statistics, computing, identifiers, and data systems. For everyday use, the 23-person result gives a useful mental anchor. Small groups can contain many pairwise comparisons. Once that idea becomes clear, the paradox feels much less mysterious.How Pair Growth Changes the Way You Should Think About Group Size
A common mistake starts with counting people instead of relationships. A group of ten feels like ten opportunities. It actually creates 45 distinct pairs. A group of twenty creates 190 pairs. Twenty-three people create 253. That growth is the hidden engine behind the birthday effect. Adding one person does more than add one new observation. The newcomer can match every existing person. This creates a compounding effect on opportunities. The probability does not rise in a straight line. It accelerates through the middle range. That explains several familiar thresholds. Fifteen people produce roughly a 25% chance. Twenty-three move past 50%. Thirty-two move past 75%. Forty-one move beyond 90%. The group size grows moderately. The match probability rises much faster. Pair thinking is also useful when checking a result. If a calculator shows a surprising probability, inspect the number of pairs. A large pair count often explains the result immediately. This mental shortcut helps prevent poor intuition. It also makes the calculator more useful for learning. Instead of accepting a percentage, the user can understand why it grows.Why “Any Pair” Is Completely Different From “Someone Shares My Birthday”
Many people silently answer the wrong question. They ask whether another person shares one specific birthday. The birthday paradox asks whether any two people match. Those events have very different numbers of opportunities. One specified person only compares against the others. The birthday paradox compares every possible pair. This distinction explains much of the surprise. A room of 23 contains only 22 comparisons with one chosen person. It contains 253 comparisons across all pairs. That is why personal-birthday intuition fails. It is solving a narrower problem. When using AxiCalculator, read the result label carefully. The output concerns at least one shared birthday somewhere in the group. It does not mean there is a 50% chance someone shares your own birthday. Keeping these questions separate prevents one of the most common probability mistakes.How Does a Birthday Paradox Calculator Turn Group Size Into Probability?
Users often want a fast result without losing mathematical meaning. A useful calculator must provide both. It should accept a group size and immediately show the probability of a shared birthday. The reliable route starts with the opposite event. Instead of counting every way a match could occur, the calculation considers the case where all birthdays remain different. That route is much cleaner. The first person creates no conflict. The next person must avoid the first birthday. Another person must avoid two occupied dates. The available safe choices continue shrinking as the group grows. The calculator combines those no-match chances. It then converts that result into the chance of at least one match. This approach avoids complicated case counting. A group could contain one matching pair. It could contain several pairs. Three people might share one date. Several separate birthday clusters could appear. Directly adding those possibilities creates overlap problems. The opposite event avoids that mess. Either everyone has a different birthday, or at least one match exists. Those outcomes cover the full space. A well-built calculator also keeps the result responsive. Changing the group size should update the probability immediately. That makes exploration easier. Users can then move through group sizes and watch the probability curve in their heads. The jump from unlikely to likely happens faster than most people expect.Why the No-Match Route Makes the Calculation Easier to Understand
Complex probability questions often become simpler through their opposite event. The birthday problem is an excellent example. “At least one match” covers many possible arrangements. “No matches” describes one clear condition. Every birthday must differ from all birthdays already seen. That condition creates a simple sequence. Each new person faces fewer unused calendar positions. The process continues until the group is complete. Once the no-match chance is known, only two possibilities remain. Either no birthday is repeated, or at least one birthday is repeated. This structure also helps users audit the result. If the probability of no match decreases, the probability of a match must increase. The two move in opposite directions. That relationship is intuitive and easy to check. It is one reason the complement method is preferred for teaching this problem.Why Directly Counting Every Possible Match Creates Unnecessary Complexity
A direct count sounds simple at first. Count every situation containing a shared birthday. Then divide by all possible birthday assignments. The difficulty appears quickly. One pair can share a date. Two separate pairs can share two dates. Three people can share one date. Larger groups can contain several overlapping collision patterns. These cases are not independent. Careless addition can count the same arrangement more than once. The no-match route avoids those overlaps completely. It describes a single clean condition. The final match probability follows from that condition. For a calculator, this matters beyond elegance. Cleaner logic is easier to test. It is also easier to explain. A calculation that users can inspect creates more trust than a mysterious percentage.Which Group Sizes Matter Most When Reading Birthday Match Probability?
A raw percentage can be hard to interpret. Benchmarks make it useful. Fifteen people produce a probability near one quarter. Twenty-three cross the halfway point. Thirty-two move beyond three quarters. Forty-one pass 90%. Forty-seven pass 95%. Fifty-seven pass 99%. Seventy move beyond 99.9%. These thresholds show how quickly the curve changes. The most dramatic growth occurs far below 365 people. That matters when users estimate a classroom, office, workshop, conference table, or team. A group does not need to be huge before a shared birthday becomes likely. The numbers also reveal an important difference between probability and certainty. A 99% chance is extremely high. It is not a logical guarantee. This distinction becomes especially important near the top of the scale. A displayed percentage may look like 100% after ordinary formatting. The underlying probability can still remain below certainty. For practical interpretation, think in ranges. Small groups have limited pair opportunities. Middle-sized groups move rapidly through major thresholds. Larger groups approach certainty quickly. The key is not memorizing every percentage. Remember the landmarks. They provide a mental map for checking results.What the 23, 32, 41, 47, 57 and 70 Person Thresholds Reveal
Each benchmark answers a different practical question. Twenty-three marks the famous 50% crossover. Thirty-two exceeds 75%. Forty-one exceeds 90%. Forty-seven moves above 95%. Fifty-seven reaches more than 99%. Seventy exceeds 99.9%. The spacing between thresholds is revealing. Moving from 50% to 75% takes only nine more people. Moving from 75% beyond 90% takes another nine. Probability rises rapidly because pair opportunities keep expanding. These landmarks can also test calculator behavior. A result far from them deserves investigation. The selected calendar model may differ. The user may be asking a different birthday question. Benchmarks therefore provide both education and quality control.How to Read Near-Certainty Without Confusing It With Guaranteed Certainty
Near-certainty can look identical to certainty on a screen. That creates a subtle interpretation risk. A value such as 99.999% means a mismatch is extremely unlikely. It does not mean impossible. Mathematical certainty occurs only when the structure forces a collision. In the standard 365-day model, 366 people cannot all occupy different birthdays. At least two must share a date. This is a logical guarantee. It differs from a very high probability. Users should therefore read both the percentage and the model. A rounded display alone cannot describe the difference.How Can You Reverse Solve a Birthday Probability Target?
Sometimes the probability is known first. A user may want the group size needed to reach 75%, 90%, or 99%. That is a different workflow. Instead of asking what probability follows from a group, the user asks which group first reaches a target. The answer must be a whole number. A group cannot contain a fraction of a person. The correct result is therefore the smallest valid group that reaches or exceeds the requested probability. This “minimum” rule matters. Suppose one group size remains just below a target. The next whole size moves above it. The larger value is the correct reverse result. A good reverse solver should not merely use a rough approximation. It should check the exact birthday probability for candidate group sizes. This makes threshold results reliable. A target of 50% returns 23, not 22. A target of 75% returns 32. A target of 90% returns 41. A target of 95% returns 47. A target of 99% returns 57. Reverse solving turns the calculator into a planning tool. It answers “how many?” rather than only “what chance?”Why Reverse Solving Must Return the Minimum Whole-Number Group
A probability threshold defines a boundary. Many larger groups may satisfy it. Only one group is the first to do so. That first group is the useful answer. Returning a larger group would technically meet the target, but it would not solve the minimum requirement. Whole-number behavior also prevents misleading outputs. A mathematical approximation might suggest a fractional group size. That value cannot exist physically. The calculator must move to a valid integer and verify the resulting probability. This is especially important near major thresholds. Users can then trust that the reverse result is not merely close. It is the first valid group that meets the chosen goal.How Boundary Checking Confirms the Correct Reverse Result
A simple boundary test provides strong confidence. Check the returned group. Then check the group immediately below it. The returned group should meet the target. The lower group should fail it. For a 50% target, 23 people pass while 22 remain below. For a 90% target, 41 pass while 40 remain below. This two-sided check is simple and powerful. It proves that the selected integer is minimal. It also provides a useful debugging method. If both sizes pass, the result may not be minimal. If both fail, the solver has stopped too early.Do Leap Years Meaningfully Change Birthday Paradox Results?
Calendar choice creates another source of confusion. The classic model usually uses 365 equally likely birthdays. A leap-year-aware average introduces slightly more outcome space. With more possible dates, the same group has a slightly lower collision probability. The difference is small for ordinary group sizes. It still matters when users want consistent assumptions. A 23-person group remains close to the famous halfway threshold. The exact percentage shifts slightly under the alternative calendar setting. Users should therefore compare like with like. Two calculators can return slightly different values without either being broken. Their calendar models may differ. AxiCalculator makes this setting explicit. That is better than hiding the assumption. The 365-day option matches the classic textbook problem. The averaged leap-year option provides another convention for users who want that adjustment. Neither setting recreates every detail of real birth data. Both are mathematical models.How the 365-Day and 365.25-Day Models Differ
The standard model treats 365 calendar dates as equally likely. It ignores February 29. The 365.25 option uses an average year length. It spreads the leap-day effect across years rather than treating one specific year. Because 365.25 is slightly larger, birthday collisions become slightly less likely for the same group. The difference is modest. It becomes visible when precise outputs are compared. This is why users should record the calendar setting when sharing or reproducing a result. A percentage without its model can create unnecessary disagreement.What the Leap-Year Setting Means in Practical Probability Work
The leap-year setting should be treated as a modeling choice. It is not a claim that a literal calendar contains a quarter-day birthday. For classroom work, the 365-day model is usually the clearest. For comparisons using the project’s averaged convention, 365.25 is available. The important point is consistency. Changing the calendar model changes the probability space. If results are being compared, everyone should use the same setting.Why Can Real Birthday Data Differ From the Textbook Model?
Real populations do not behave like perfect random-number generators. Birth frequencies vary by date and season. The classic birthday problem deliberately simplifies that reality. It assumes birthdays are independent and evenly distributed across the selected calendar. That simplification is useful. It creates a clean probability model that can be reproduced anywhere. Real-world deviations do not make the model mathematically wrong. They mean the model answers a specific theoretical question. If birthdays are unevenly distributed, some dates receive more probability mass than others. That can change collision behavior. Dependence can matter too. Twins are an obvious case. Family patterns can also break complete independence. For most teaching and intuition tasks, the classical model remains appropriate. It clearly demonstrates collision probability. For demographic research, population-specific birth-frequency data would be more suitable. Understanding that distinction builds trust. A calculator should not pretend that a theoretical model exactly describes every population.How Seasonality and Dependence Change Real Population Behavior
Uniform probability gives every date the same chance. Real birth records do not follow that pattern perfectly. Some periods contain more births than others. Scheduled procedures can also affect weekday patterns. Related individuals may introduce dependence. Concentrating probability on certain dates creates more collision opportunities. The direction of change is intuitive. Popular dates are more likely to attract repeated birthdays. However, the exact effect depends on the population dataset. A global calculator cannot silently assume one country’s birth pattern represents everyone. The classical model avoids that problem by being explicit and reproducible.When the Classical Model Is Still the Right Tool to Use
Use the classical model when the goal is probability education, intuition, benchmarking, or generic collision reasoning. It is especially useful when comparing group sizes. The assumptions remain constant, so the effect of headcount becomes clear. Use population data when the question concerns real birth frequencies for a specific region or period. These are different jobs. Choosing the model based on the question prevents false precision.Why Does the Birthday Paradox Matter in Cryptography and Collision Analysis?
The birthday idea becomes more powerful when birthdays disappear completely. Imagine many random values entering a finite set of possible outputs. A collision occurs when two inputs produce the same output. That structure resembles birthdays. People become inputs. Calendar dates become output buckets. A repeated date becomes a collision. This matters for hash functions and random identifiers. A huge output space can still produce collisions sooner than naive intuition expects. The important distinction remains “any collision” versus “one chosen collision.” Searching for any matching pair benefits from the rapidly growing number of comparisons. This is why collision resistance receives special attention in cryptography. The calculator’s birthday model should not be treated as a complete security analyzer. Cryptographic systems involve output sizes, algorithms, threat models and implementation details. Still, the birthday paradox provides the essential intuition. Pair opportunities can make collisions relevant far before every output has been used. That insight is one reason this probability problem remains important beyond classrooms.How Shared-Birthday Logic Becomes Hash-Collision Logic
A birthday date is simply a bucket in the probability model. A hash output can play the same role. When many independent inputs are mapped into a fixed output space, repeated outputs eventually become likely. The key insight remains pair growth. Every new item can collide with all earlier items. This is why thinking only about the number of possible outputs can be misleading. The number of comparisons matters too. The birthday analogy gives engineers a fast mental model for understanding collision risk.Why Collision Resistance Depends on More Than the Number of Possible Outputs
A large output space sounds reassuring. It does not tell the whole story. Security also depends on how many samples an attacker can generate. The algorithm’s design matters. The required security level matters too. Birthday reasoning concerns generic collision probability. It should not be used as a substitute for modern cryptographic guidance. For AxiCalculator users, the value is conceptual. It shows why “many possibilities” does not automatically mean “collisions are irrelevant.”Which Reasoning Mistakes Cause the Most Birthday Probability Errors?
The largest errors often come from interpretation, not arithmetic. The first mistake is confusing any-pair probability with one-person probability. These questions look similar but behave very differently. The second mistake is comparing group size directly with 365. A group does not need 183 people for a 50% match chance. The third mistake is treating a high probability as certainty. A 99.9% chance still allows a no-match outcome. The fourth mistake is mixing calendar models. Results using different day counts should not be compared as though their assumptions match. The fifth mistake is using an approximate reverse value without checking the integer boundary. The sixth mistake is assuming real birthday frequencies are perfectly uniform. That is a model choice, not a demographic fact. The seventh mistake is confusing pair count with expected matches. Pair count describes opportunities. It does not mean that many birthday matches will occur. Avoiding these mistakes makes the calculator far more useful.Why Personal-Birthday Odds Should Never Replace Any-Pair Odds
Suppose someone asks whether another person shares your birthday. Only one fixed date matters. Now change the question. Ask whether any two people share any birthday. Every pair can produce a success. The second question contains far more opportunities. Its probability rises much faster. This distinction should be checked before any calculation begins. If the wording says “any two,” use the birthday paradox model. If it names one person’s birthday, it is a different probability problem.Why High Probability and Mathematical Certainty Are Not the Same
Probability describes uncertainty. Certainty describes an outcome that cannot be avoided. Large groups can reach 99%, 99.9%, and even higher probabilities. A rare no-match outcome remains mathematically possible. The guarantee appears when there are more people than available birthday positions. This difference matters when interpreting rounded results. “Almost certain” and “guaranteed” should never be treated as synonyms. AxiCalculator makes that distinction easier to inspect through exact group inputs and explicit calendar settings.Frequently Asked Questions
Why does a group of 23 people already have better-than-even shared birthday odds?
Why can two correct birthday calculators return slightly different percentages?
What should I do if the calculator displays almost 100% but not mathematical certainty?
Can I use the birthday paradox for something other than birthdays?
How should I validate a reverse-solved group size in statistical work?
When is the uniform 365-day model unsuitable for research data?
How does the birthday problem help engineers understand cryptographic collision risk?
Engineering Resources
Our engineers are here to help you get it right.