Average Atomic Mass Calculator
- Last formula update:
Decimal & Rounding Policy
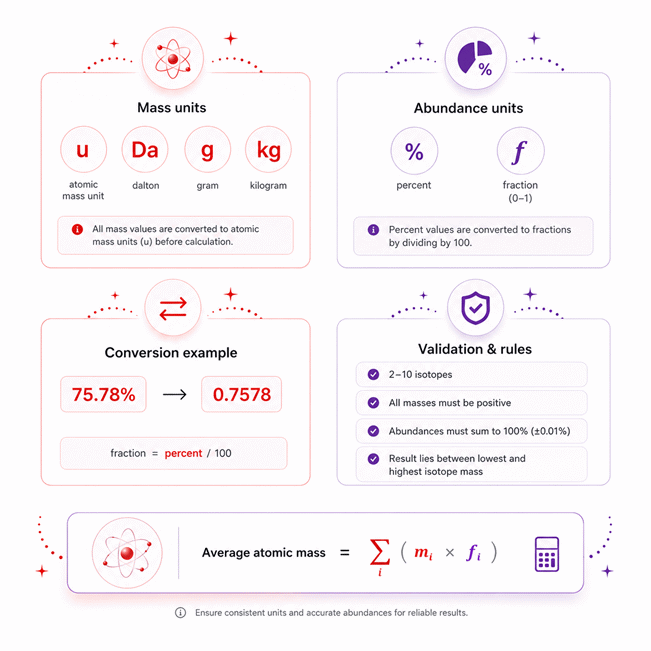
- Keep full numerical precision throughout all intermediate calculations and round only the final displayed result.
- Display the average atomic mass to up to 6 decimal places when additional precision is meaningful.
- Do not round isotope masses, fractional abundances, percentages, or weighted contributions before the final calculation.
- Remove unnecessary trailing zeros while preserving significant decimal information entered by the user.
- Use scientific notation when unit conversions produce extremely small or large values that are difficult to read in standard decimal form.
Valid range
- Number of isotopes: Enter 2 to 10 isotopes for the average atomic mass calculation.
- Isotope mass: Each isotope mass must be a finite positive value greater than 0.
- Isotopic abundance: Enter each abundance from 0% to 100%, or from 0 to 1 when using fractional abundance.
- Total abundance: All isotope abundances must add up to 100%, equivalent to a fractional total of 1.
- Average atomic mass: With normalized abundances, the calculated value must fall between the lowest and highest entered isotope masses.

Xylena Morforde
Reviewers:
Cirelle Vossford
Zorven Lumquell
Check our editorial policy
September 1, 2026
1.0.0
Initial calculator and formula release.
Our engineers are here to help you get it right.
How Does the Average Atomic Mass Calculator Work and What Does the Result Mean?
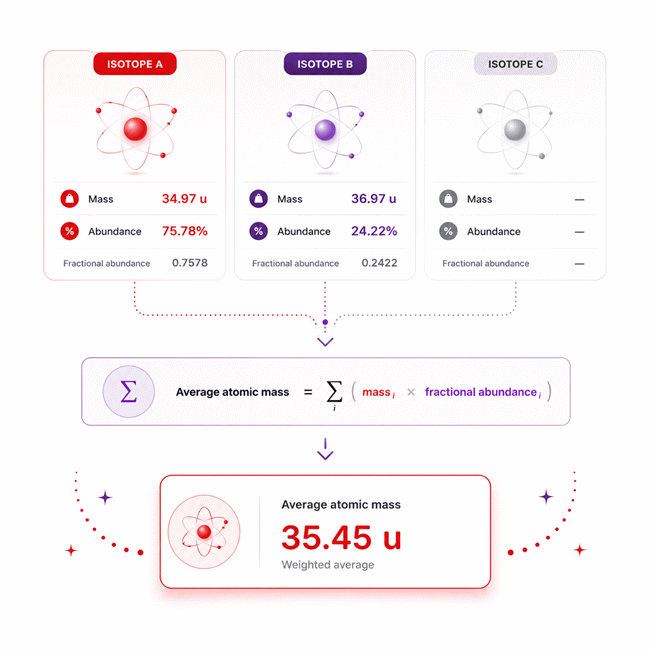
Average Atomic Mass Calculator results combine isotope masses with their relative abundances to produce a weighted atomic mass. Each isotope influences the result according to how common it is within the selected mixture. This approach is more accurate than taking a simple arithmetic average because isotopes rarely occur in equal proportions.
- The most abundant isotope usually pulls the final average closest to its mass.
- Average atomic mass represents an isotope mixture, not the mass of one atom.
- Different isotope compositions can produce different average atomic mass values.
- Natural, enriched, and depleted materials may have different isotopic compositions.
- A result may differ from a periodic-table value without being scientifically incorrect.
- Reverse solving can determine one missing isotope mass or abundance when sufficient data exists.
- Two independent unknown values normally require additional information for a unique solution.
- Isotope mass and mass number are different and should not be confused.
- A simple average can produce a misleading result when isotope abundances are unequal.
The Average Atomic Mass Calculator supports both forward and reverse problem solving. It helps students, educators, laboratory users, and technical professionals understand how isotope composition changes the final result. The key is simple: isotope mass sets the value, while isotope abundance determines its influence.
Assumptions used in this calculator
- Isotope masses are assumed accurate and entered using compatible mass units.
- Isotopic abundances represent the same element and the same sample composition.
- Percentage abundances are assumed to represent values between zero and one hundred.
- Fractional abundances are assumed to represent values between zero and one.
- Total isotopic abundance is expected to equal one hundred percent.
- Average atomic mass is calculated using abundance-weighted isotope masses.
- Intermediate calculations retain full precision before final display rounding.
- Entered isotope values are assumed to come from reliable scientific sources.
- Natural isotopic composition may vary between materials, samples, or locations.
- Published standard atomic weights may differ from sample-specific calculated values.
- Unit conversions are assumed dimensionally valid and correctly selected by users.
- Industrial decisions should include independent verification against approved technical data.
- Results are informational and do not replace laboratory or regulatory validation.
Results are rounded for display.
Internal calculations use full precision.
Formulas Used in Average Atomic Mass Calculator :
Convert Mass Inputs to Unified Atomic Mass Units
Convert Percent Abundance to Fractional Abundance
Validate Total Isotopic Abundance
Calculate Average Atomic Mass
Reverse Solve a Missing Isotope Mass
Reverse Solve a Missing Isotope Abundance
- AM = average atomic mass.
- xi = entered mass of isotope i in the selected mass unit.
- mi = mass of isotope i converted to unified atomic mass units.
- pi = percentage abundance of isotope i.
- fi = fractional abundance of isotope i.
- i = isotope index.
- k = index of the isotope containing the single unknown value.
- n = total number of isotopes included in the calculation.
Variables & Definitions
View a complete list of all variables used in this calculator, including definitions and units
Average Atomic Mass Calculator Variables and Symbols
| Variable | Name | Description | Unit | Role in Calculation |
|---|---|---|---|---|
| AM | Average Atomic Mass | The weighted average mass of all isotopes included in the calculation. | u, Da, kg, or g | Final calculated value or target value for reverse calculation. |
| pi | Percentage Abundance | The percentage of isotope i present in the isotope mixture. | % | Converted to fractional abundance before the weighted calculation. |
| fi | Fractional Abundance | The decimal fraction representing the abundance of isotope i. | Dimensionless | Multiplied by the corresponding isotope mass. |
| mi | Isotope Mass | The atomic mass of isotope i used in the weighted average. | u, Da, kg, or g | Provides the mass contribution of each isotope. |
| i | Isotope Index | The position of an individual isotope in the entered isotope set. | Dimensionless | Identifies each isotope and its corresponding mass and abundance. |
| n | Number of Isotopes | The total number of isotopes included in the calculation. | Count | Defines the number of isotope terms included in the weighted sum. |
Unit Conversion Table
Average Atomic Mass Calculator Unit Conversion Table
| Unit Group | Unit Name | Symbol | Equivalent in Base Unit | Used For |
|---|---|---|---|---|
| Popular Units | Unified Atomic Mass Unit | u | 1 u | Isotope mass and average atomic mass |
| Popular Units | Dalton | Da | 1 Da = 1 u | Atomic, molecular, and isotope mass |
| Scientific Units | Kilogram | kg | 1 kg ≈ 6.022140762 × 1026 u | SI mass conversion for isotope and average atomic mass |
| Scientific Units | Gram | g | 1 g ≈ 6.022140762 × 10²³ u | Scientific and laboratory mass conversion |
| Popular Units | Percentage Abundance | % | 1% = 0.01 fraction | Entering and displaying isotopic abundance |
| Scientific Units | Fractional Abundance | fraction | 1 fraction = 100% | Weighted average atomic mass calculations |
Example Calculation
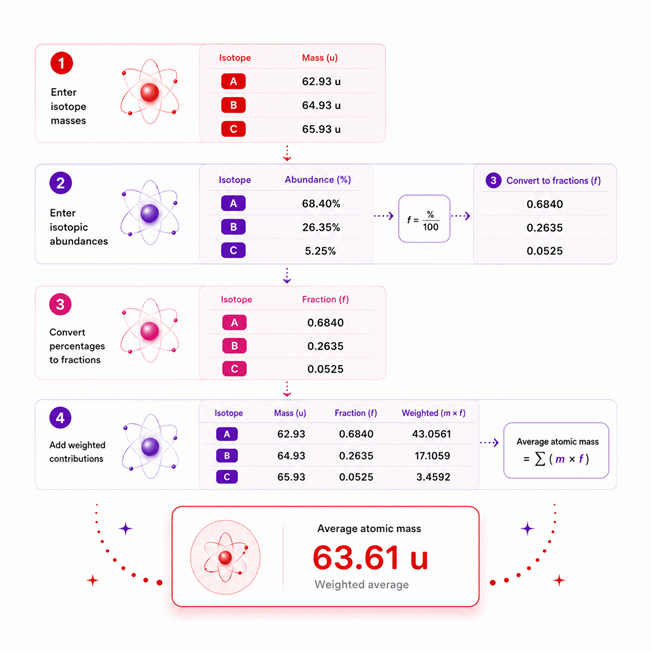
Isotope 1
Mass: 62.930 u
Abundance: 68.40%
Isotope 2
Mass: 64.928 u
Abundance: 26.35%
Isotope 3
Mass: 65.926 u
Abundance: 5.25%
Convert percentage abundance to fractional abundance
- f1 = 68.40 / 100 = 0.6840
- f2 = 26.35 / 100 = 0.2635
- f3 = 5.25 / 100 = 0.0525
Apply the weighted-average formula
Calculate each isotope contribution
- 0.6840 × 62.930 = 43.044120 u
- 0.2635 × 64.928 = 17.108528 u
- 0.0525 × 65.926 = 3.461115 u
Total abundance = 100.00%
Average atomic mass = 63.613763 u
General calculation formulas
The three isotope abundances total 100%, so no normalization is required.
Each percentage is converted to a decimal fraction before multiplication.
Each isotope contributes according to both its mass and its relative abundance.
The contributions are added without intermediate rounding to obtain the final average.
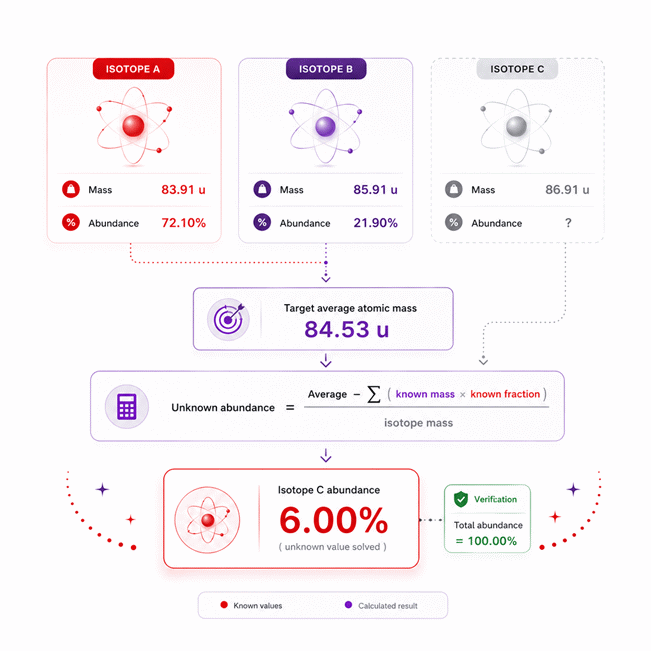
Isotope 1
Mass: 83.912 u
Abundance: 72.10%
Isotope 2
Mass: 85.910 u
Abundance: 21.90%
Isotope 3
Mass: 86.909 u
Abundance: Unknown
Known average atomic mass
Convert known percentages to fractional abundances
- f1 = 72.10 / 100 = 0.7210
- f2 = 21.90 / 100 = 0.2190
Rearrange the weighted-average equation for the unknown abundance
Substitute the known values
- 0.7210 × 83.912 = 60.500552 u
- 0.2190 × 85.910 = 18.814290 u
- 84.529382 − 60.500552 − 18.814290 = 5.214540 u
- f3 = 5.214540 / 86.909 = 0.0600
- p3 = 0.0600 × 100 = 6.00%
Unknown abundance = 6.00%
Total abundance = 72.10% + 21.90% + 6.00% = 100.00%
Verified average atomic mass = 84.529382 u
General reverse-solving formulas
Reverse solving treats the entered average atomic mass as a known target.
All isotope values except one unknown must be available for a unique solution.
The weighted contributions of the known isotopes are removed from the target average.
The solved abundance is verified by confirming that all abundances total 100%.
Results are rounded for display.
Internal calculations use full precision.
Calculations Disclaimer
Average Atomic Mass Calculator: What the Result Really Tells You
An Average Atomic Mass Calculator answers a simple but important chemistry question. The Average Atomic Mass Calculator combines isotope masses with their real abundance. The result represents a weighted average for the selected isotope mixture. It is not a simple mean of isotope masses. That difference changes everything.
A common problem starts with two or more isotope values. Their masses may look very close. Their natural abundance can be very different. A simple average treats every isotope equally. Nature does not work that way. A common isotope influences the result much more than a rare isotope.
Why Average Atomic Mass Is a Weighted Value
Imagine one isotope dominates almost the entire sample. Another isotope appears only in small amounts. The final atomic mass should stay near the dominant isotope. A normal average would pull the value too far away. A weighted approach keeps the result physically meaningful.
This idea explains many decimal values on the periodic table. Individual atoms belong to specific isotopes. A large collection can contain several isotopes. Each isotope adds a different share to the measured average. The final value reflects the complete isotope distribution.
Quick insight: The most abundant isotope usually pulls the average closest to itself.
Which Data Describes the Isotope Mixture?
Each isotope needs two useful pieces of information. The first is its isotope mass. The second is its relative share in the mixture. Together, these values describe each isotope’s influence.
The isotope mass tells you how heavy that isotope is. The abundance tells you how common it is. A heavy isotope with tiny abundance may have limited influence. A slightly lighter isotope with high abundance may dominate the result.
This relationship matters outside classroom exercises. Isotope composition can vary between materials. Enriched materials can differ greatly from natural materials. A calculation should therefore describe the actual dataset being used.
Isotope mass → Relative share → Weighted contribution → Combined atomic mass
Who Benefits From This Calculation?
Students can use it to check chemistry work quickly. Teachers can demonstrate why weighted averages matter. Laboratory teams can review isotope datasets before deeper analysis. Researchers can compare mixtures with different isotope distributions.
The key benefit is visibility. You can connect each isotope to the final value. That makes mistakes easier to notice. It also makes the chemistry easier to understand.
AxiCalculator is designed around this clear workflow. Enter the isotope data and review the resulting average. The calculator removes repetitive arithmetic while keeping the scientific logic visible.
How Average Atomic Mass Changes With Isotope Composition
A result can look surprising even when every isotope mass is correct. The cause is often the isotope composition. Small changes in composition can shift the final average. The size of that shift depends on the isotope masses involved.
Why the Most Abundant Isotope Matters Most
The most abundant isotope usually has the largest influence. Its effect grows because more atoms belong to that isotope. The final average therefore tends to sit near its mass.
This gives you a useful mental check. First identify the dominant isotope. Then compare its mass with the calculated average. The result should often appear reasonably close to that dominant isotope.
That rule is not absolute by itself. Other isotope masses also matter. A less common isotope can still create a noticeable shift. This happens when its mass differs greatly from the dominant isotope.
Look first at abundance, then inspect mass differences. That reveals the dominant influence.
Why Equal Averaging Can Give the Wrong Answer
Suppose a mixture contains three isotopes. Their shares are not equal. Adding their masses and dividing by three ignores that fact. The result represents an imaginary equal mixture instead.
This is one of the most common conceptual mistakes. The arithmetic may look perfect. The scientific meaning is still wrong. Correct chemistry requires the isotope distribution to influence the average.
A useful way to think about this is voting power. Each isotope has a mass value. Its abundance determines how many votes that mass receives. The final average reflects all those weighted votes.
How Sensitive Is the Result to Composition?
Sensitivity depends on two factors. One factor is the change in abundance. The other is the distance between isotope masses.
Very similar isotope masses create smaller shifts. Widely separated isotope masses can create larger shifts. Even a modest composition change may then become noticeable.
This matters when comparing natural and enriched samples. The same element can have different isotope distributions. Their calculated average masses can therefore differ.
That does not mean the element changed identity. Its proton count remains unchanged. The isotope mixture changed instead.
Small mass gap + composition change → Smaller shift
Large mass gap + composition change → Larger shift
Dominant isotope + high abundance → Average moves toward that isotope
This simple pattern helps users judge results quickly. It also makes unexpected answers easier to investigate.
Reverse Solving Average Atomic Mass When One Value Is Missing
Sometimes the average atomic mass is already known. The missing value lies inside the isotope data. That changes the direction of the problem. Instead of finding the average, you solve backward.
This ability is useful when one isotope value is unknown. The known weighted contributions can be separated first. The remaining contribution belongs to the missing value.
Finding a Missing Isotope Abundance
A missing abundance problem begins with a known target average. The isotope masses are known. Other isotope abundances are also known. Only one abundance remains unknown.
The known isotopes already account for part of the target average. Their combined influence can be identified. The remaining influence belongs to the isotope with unknown abundance.
The unknown share can then be isolated from that remaining contribution. This is reverse solving. It uses the same scientific relationship as forward calculation.
The process is especially useful for chemistry exercises. It can also help review incomplete isotope datasets. The result should still make sense within the full mixture.
One missing value can be solved. Two independent unknowns usually need more information.
Finding a Missing Isotope Mass
The same reverse logic can solve a missing isotope mass. The target average must be known. The missing isotope’s abundance must also be known.
First, the known isotope contributions are accounted for. Their effect is removed from the target average. The remaining contribution belongs to the unknown isotope.
That contribution can then reveal the missing isotope mass. The result should remain chemically reasonable for the selected element.
This feature is useful because calculators often work only forward. Real problems do not always present data in that order. A flexible tool should support both directions.
When Reverse Solving Has a Unique Solution
A unique answer requires enough independent information. One unknown can often be solved from one complete relationship. Two unrelated unknowns cannot usually be found from one target alone.
This is an important limit. A calculator should not invent missing information. It should solve only what the available data can support.
For example, an unknown mass needs its abundance relationship. An unknown abundance needs its isotope mass relationship. If both are missing together, another independent condition is needed.
Understanding this limit prevents false confidence. A numerical output should come from sufficient information. It should never come from an unsupported guess.
Average Atomic Mass Versus Atomic Weight, Isotope Mass, and Mass Number
Many wrong answers begin with the wrong type of atomic data. Several chemistry terms look similar. They do not always mean the same thing.
Knowing these differences helps you choose the correct input. It also prevents misleading comparisons with reference values.
Average Atomic Mass and Individual Isotope Mass
An isotope mass describes one specific isotope. Average atomic mass describes an isotope mixture. These values answer different questions.
An element may contain several naturally occurring isotopes. Each isotope has its own mass. The overall mixture produces a weighted average.
This is why the average can fall between isotope masses. No individual atom needs that exact average mass. The number describes the population instead.
Average Atomic Mass and Atomic Weight
Atomic weight often describes the weighted isotopic composition of an element. Context remains important. Reference values may represent typical terrestrial materials.
Your own sample may have a different isotope distribution. Its calculated value can therefore differ from a published reference. That difference can be scientifically meaningful.
For general chemistry work, the concepts are closely related. For precise scientific work, their definitions should remain distinct.
Isotope Mass and Mass Number
Mass number is an integer. It counts protons and neutrons inside one nucleus. Isotope mass is a measured physical mass for that isotope.
These two numbers can look similar. They are not interchangeable in precise work. Using mass numbers can create an approximate result.
This distinction becomes more important when high accuracy is required. Exact isotope masses carry more physical information than integer mass numbers.
Why This Difference Matters in Real Calculations
A calculation can be mathematically correct but scientifically weak. That happens when the wrong input type is used.
If a dataset supplies measured isotope masses, use those values. Do not replace them with integer labels. The isotope label identifies the isotope. It does not replace its measured mass.
This simple check can prevent a surprising result. It also helps explain differences between classroom estimates and scientific datasets.
Why Your Calculated Atomic Mass May Differ From the Periodic Table
A user often expects the calculator to match a periodic table exactly. A small difference can then cause concern. The difference may be valid.
A periodic table value represents a reference context. Your calculation represents the isotope data you entered. Those two datasets may not describe identical material.
Natural Isotopic Composition Can Vary
Nature does not always produce one fixed isotope mixture. Some elements show measurable variation between materials. Geological and chemical processes can change isotope distributions.
This means two natural samples can produce slightly different weighted values. The element remains the same. Its isotope composition differs.
The effect is especially important in isotope science. Environmental studies also use these variations. Geochemistry and forensic work can use them as useful signals.
A calculator should therefore answer a specific question. What average follows from this isotope dataset? It should not assume every sample matches one reference composition.
Enriched and Depleted Materials Can Shift the Average
Industrial and research materials may have altered isotope composition. One isotope may be enriched. Another may be depleted.
The resulting average will move toward the enriched isotope. This behavior follows directly from weighted composition.
Such a result should not be rejected automatically. It may accurately describe the supplied material. The first task is checking the isotope dataset.
Reference Values and Sample-Specific Values Serve Different Purposes
A reference value helps describe standard or representative material. A sample-specific result describes the selected isotope composition.
Those values can agree closely. They can also differ for valid reasons. The right value depends on the question being asked.
This distinction creates a better workflow. First identify the source of the isotope data. Then decide what the result should represent.
For teaching, a standard composition may be suitable. For enriched material, sample data matters more. For research, measured composition may be essential.
That context makes the final number more useful. It turns a calculation into meaningful scientific information.
Common Average Atomic Mass Mistakes That Can Mislead the Result
A wrong answer often begins before any arithmetic happens. The user may choose incorrect isotope data. The dataset may describe another material. A mass number may replace an isotope mass.
These mistakes can produce believable numbers. That makes them more dangerous than obvious errors.
Using a Simple Average Instead of a Weighted Average
This mistake treats every isotope as equally common. That rarely matches a natural isotope mixture.
The result may still fall between isotope masses. It can therefore look reasonable. The hidden problem is the ignored composition.
Always ask one question first. Are all isotopes present in equal amounts? If not, a simple mean is inappropriate.
Mixing Isotope Data From Different Compositions
A dataset should describe one coherent isotope mixture. Combining values from unrelated samples can create a meaningless result.
This risk grows when data comes from several documents. One source may describe natural material. Another may describe enriched material.
Before calculating, confirm that all abundance values share the same context. This check can prevent a technically polished but useless answer.
Using Mass Number Instead of Isotope Mass
Mass numbers are easy to recognize. They are also easy to misuse. Their integer form makes manual calculations convenient.
Convenience does not make them exact isotope masses. Precision work should use the proper isotope mass data.
This difference can explain why two solutions disagree. One may use isotope labels. The other may use measured isotope masses.
Trying to Reverse Solve Too Many Unknowns
Reverse solving is powerful, but it has mathematical limits. One target does not automatically reveal several independent unknowns.
If two values are missing, several combinations may satisfy the same average. A single result cannot identify the unique composition.
Another independent condition is then required. Without it, the problem remains underdetermined.
Assuming Every Reference Atomic Mass Describes Every Sample
This assumption can hide real isotope variation. Reference values are useful benchmarks. They are not measurements of every physical sample.
If your calculated result differs, inspect the isotope composition first. Do not immediately assume the calculation failed.
A result becomes more trustworthy when its context is clear. The data should answer the same question as the comparison value.
Choosing a Better Workflow for Average Atomic Mass Problems
A long calculation becomes easier when the workflow stays predictable. The goal is not more arithmetic. The goal is fewer hidden mistakes.
Start With the Scientific Question
First decide what you need to find. You may need an overall average. You may need one missing isotope value. These are different workflows.
For a forward calculation, the isotope dataset drives the result. For reverse solving, the target average becomes known information.
This simple decision prevents unnecessary work. It also helps you notice when required information is missing.
Check the Meaning of Every Input
Do not rely only on the number. Ask what that number represents.
Is it an isotope mass? Is it a mass number? Is it an abundance? Is the composition natural or enriched?
This short review can prevent many errors. It takes less time than repeating a full calculation.
Use the Result as a Scientific Signal
The final number should tell a story about the isotope mixture. A dominant isotope should influence the result clearly.
If the answer looks unexpected, investigate the composition. Compare the result with the isotope masses. Look for the strongest contribution.
This approach turns the calculator into a reasoning tool. It does more than return a number.
A Fast Decision Path for Students and Technical Users
Need the average? Enter the complete isotope composition and calculate forward.
Know the average but miss one value? Use reverse solving.
See an unexpected result? Check the isotope type and composition context.
Comparing with a reference value? Confirm both describe similar material.
Working with enriched material? Expect the weighted value to shift accordingly.
This decision path keeps the process simple. It also helps new users build correct habits.
Why AxiCalculator Fits This Workflow
AxiCalculator keeps the calculation connected to the isotope data. The tool supports both forward and reverse problem solving.
This matters when chemistry problems do not follow one fixed format. A user can start from the known values available.
The workflow also reduces repetitive manual steps. That leaves more attention for the scientific meaning.
For students, this supports learning and verification. For educators, it supports clear demonstrations. For technical users, it speeds repeated isotope checks.
The useful question is not only, “What is the answer?” A better question is, “Why does this isotope mixture produce that answer?”
That shift improves understanding. It also makes unusual results easier to investigate.
Open the calculator, enter the isotope data, and review the relationship. If one linked value is missing, solve from the known target. The result becomes easier to trust because the reasoning remains visible.
Frequently Asked Questions
Should I include every isotope in the average atomic mass calculation?
Can I use relative mass-spectrum peak intensities as isotope abundances?
What should I do when an isotope abundance is reported below a detection limit?
Can I compare the average atomic mass of two different samples?
How should uncertainty in isotopic abundance be handled in professional calculations?
Can average atomic mass help identify isotope enrichment or possible contamination?
What should be documented so an average atomic mass calculation is reproducible?
Our engineers are here to help you get it right.