Coin Toss Streak Probability Variables and Calculation
- Last formula update:

Decimal & Rounding Policy
- All streak sequence counts are calculated at full integer precision before probability conversion.
- No intermediate probability values are rounded during the recurrence calculation.
- Decimal and percentage probabilities are rounded only when displayed to the user.
- Percentage results are obtained by multiplying the final decimal probability by 100.
- Exact fractions remain unreduced-lossless probability ratios whenever exact fraction output is available.
- Reverse solving uses the entered probability precision and never guesses between multiple valid matches.
Valid range
- Number of flips (n): whole numbers from 1 to 1000.
- Target head-streak length (k): whole numbers from 0 to 1000.
- An attainable longest streak satisfies 0 ≤ k ≤ n.
- For k > n, exact and at-least probabilities are 0, while at-most probability is 1.
- Decimal probability input: values from 0 to 1 inclusive.
- Percentage probability input: values from 0% to 100% inclusive.
- Fraction probability input: a valid nonnegative fraction not greater than 1.
- Exact fraction display is supported when the number of flips is below 30.
- Probability distribution display is supported for up to 100 flips.
- Reverse solving requires one uniquely matching integer input within the supported range.

Wylena Brantford
Reviewers:
Valdren Clyforde
Zenara Dentwick
Check our editorial policy
September 22, 2026
1.0.0
Initial calculator and formula release.
Our engineers are here to help you get it right.
How Does the Coin Toss Streak Calculator Find Consecutive Heads Probability?
Coin Toss Streak Calculator results measure the longest consecutive run of heads across a complete sequence of fair, independent coin flips. Unlike ordinary head-count probability, streak probability depends on the order of outcomes and must account for overlapping possible runs.
- Choose how many fair coin flips are included.
- Enter the head-streak length you want to examine.
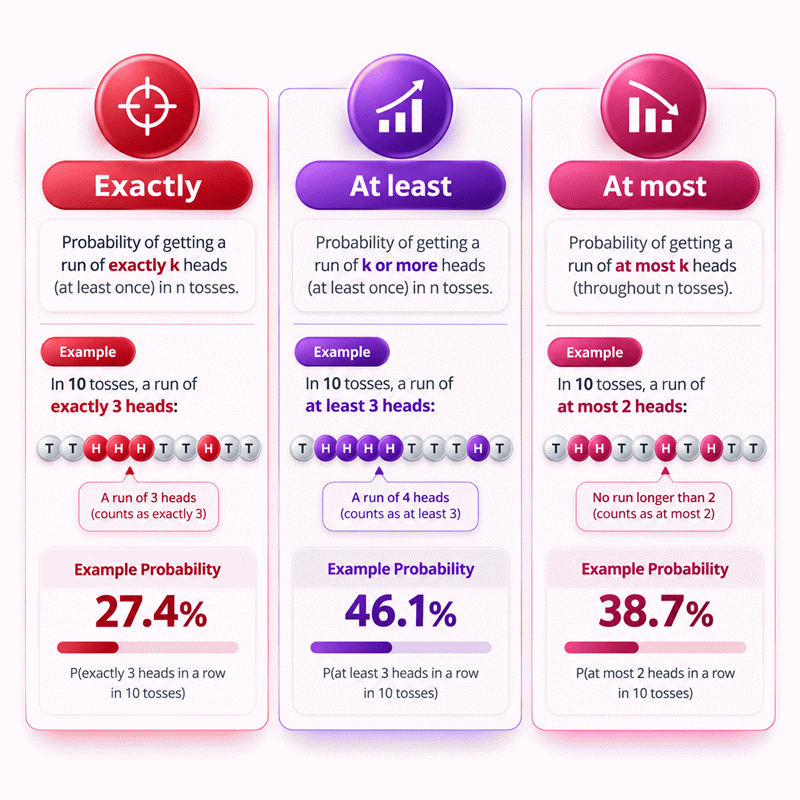
- Select Exactly, At least, or At most.
- Exactly means the longest run equals the selected length.
- At least includes the selected length and every longer run.
- At most includes every sequence that stays within the selected limit.
- Overlapping streak positions are handled without double-counting complete sequences.
- The next fair toss remains independent after any observed streak.
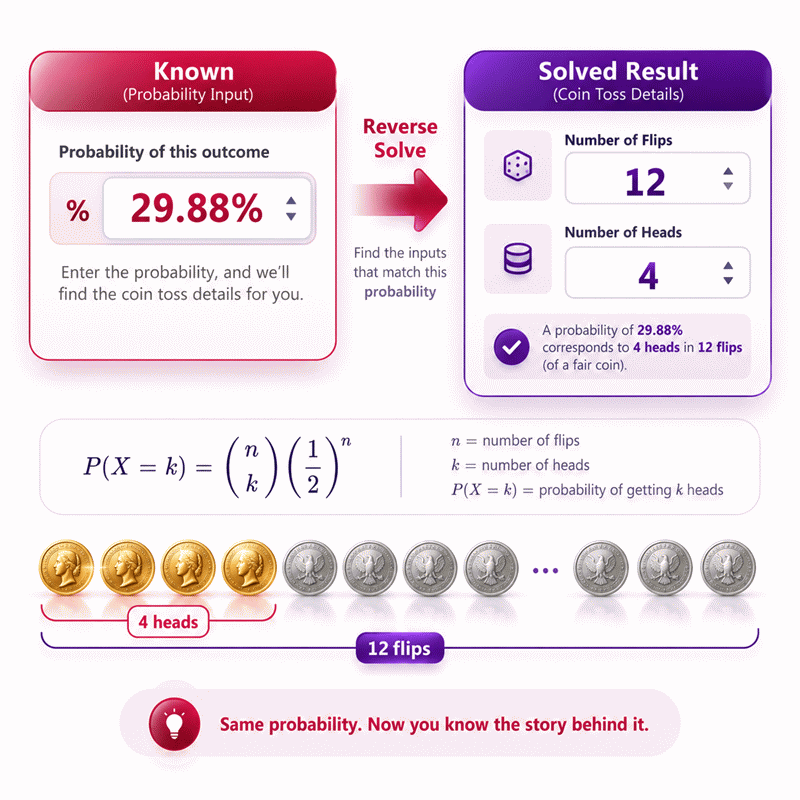
- Reverse solving can find a missing integer input from a target probability when the match is unique.
The Coin Toss Streak Calculator is especially useful when simple 0.5-based intuition becomes misleading. It separates a streak at one fixed location from a streak appearing anywhere in a longer sequence, helping users interpret random clustering more accurately.
Assumptions used in this calculator
- Each coin is fair, giving heads and tails equal probability.
- Every toss is independent of all previous and future tosses.
- Toss conditions remain unchanged throughout the experiment.
- The calculator tracks the longest consecutive run of heads only.
- A streak ends immediately when a tail occurs.
- Zero heads represents no head appearing in the complete sequence.
- Total possible sequences equal two raised to the number of flips.
- All length-n outcome sequences are treated as equally likely.
- Inputs for flips and streak length are whole numbers.
- Exact fractions use integer sequence counts without intermediate rounding.
- Decimal and percentage outputs represent the same underlying probability.
- Reverse solving accepts only a uniquely matching integer input.
- Distribution output uses the same longest-run probability model as results.
Results are rounded for display.
Internal calculations use full precision.
Formulas Used in Coin Toss Streak Probability Variables and Calculation :
Initial sequence-count conditions
Longest-run recurrence
At-most streak probability
At-least streak probability
Exact streak probability
Reverse calculation rule
n = total number of coin flips.
k = selected longest-head-streak length.
j and i = integer recurrence indices.
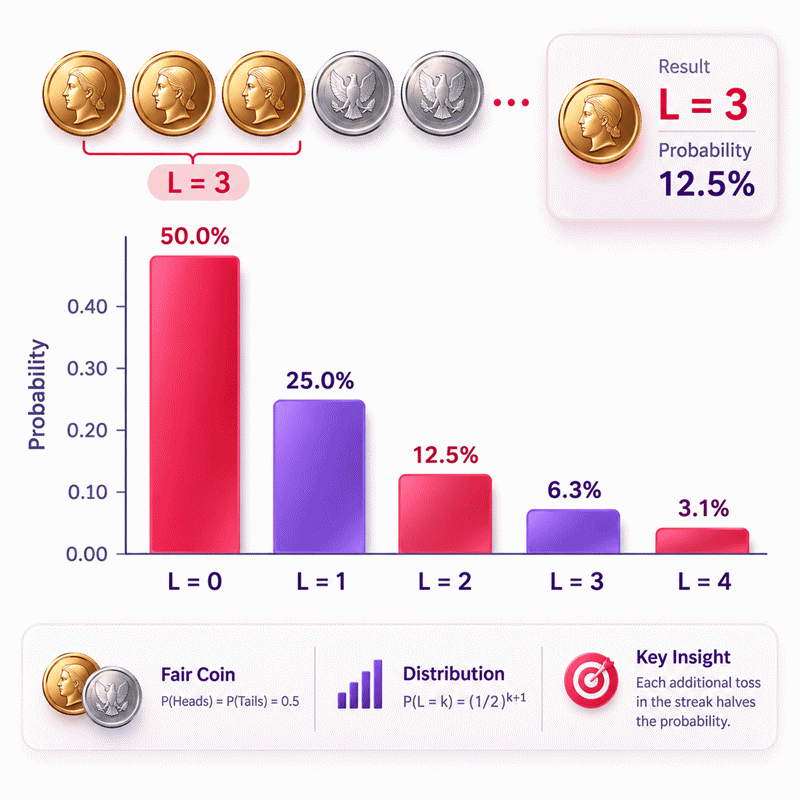
L = random variable representing the longest consecutive head streak.
f(k,n) = number of length-n sequences whose longest head streak does not exceed k.
P = probability under the fair independent coin model.
r = selected relation mode: exact, at least, or at most.
Pr(n,k) = probability produced by the selected relation mode.
ptarget = probability entered for reverse solving.
x = the missing integer input being solved.
Dx = supported integer search domain for the missing input.
x* = unique reverse-calculated solution.
Variables & Definitions
View a complete list of all variables used in this calculator, including definitions and units
Coin Toss Streak Probability Variables and Calculation Terms
| Variable | Meaning | Type / Range | Unit | Role in Calculation |
|---|---|---|---|---|
n |
Total number of coin flips | Integer, 1 to 1000 | flips | Defines sequence length and total outcome count 2^n. |
k |
Selected longest-head-streak length | Integer, 0 to 1000 | heads | Defines the exact, minimum, or maximum streak threshold. |
L |
Longest consecutive run of heads | Random integer, 0 to n | heads | Random variable whose distribution is calculated. |
f(k,n) |
Valid sequence count | Nonnegative integer | sequences | Counts outcomes whose longest head streak is at most k. |
j |
Initial-condition sequence index | Integer, 0 to k | flips | Indexes the initial values f(k,j) = 2^j. |
i |
Recurrence summation index | Integer, 1 to k + 1 | dimensionless | Selects earlier terms included in the recurrence sum. |
P |
Probability | 0 to 1 | decimal probability | Represents the likelihood of the selected streak event. |
r |
Relation mode | Exact, at least, or at most | dimensionless | Selects which streak probability is returned. |
P_r(n,k) |
Probability for the selected relation | 0 to 1 | decimal probability | Final probability before display-unit conversion. |
p_target |
User-entered target probability | 0 to 1 after conversion | decimal probability | Target used when solving a missing input in reverse mode. |
x |
Missing reverse-solved input | Supported integer value | flips or heads | Represents either n or k when that input is unknown. |
D_x |
Reverse search domain | Supported integer set | flips or heads | Contains all candidate values tested during reverse solving. |
x* |
Unique reverse solution | Single matching integer | flips or heads | Returned only when one candidate matches the target probability. |
Unit Conversion Table
Coin Toss Streak Calculator Unit Conversion Table
| Unit Group | Unit Name | Symbol | Equivalent in Base Unit | Used For |
|---|---|---|---|---|
| Flip Count | Coin Flip | flips | 1 flip = 1 toss | Total number of independent coin tosses |
| Streak Count | Consecutive Head | heads | 1 head = streak length 1 | Length of the consecutive head streak |
| Probability | Percent | % | 1% = 0.01 decimal probability | User-friendly probability input and result display |
| Probability | Decimal Probability | p | 1.0 = 100% | Core probability calculation and reverse solving |
| Probability | Exact Fraction | a/b | a/b = a ÷ b decimal probability | Exact probability representation without decimal rounding |
Example Calculation
Streak condition = At least
Number of consecutive heads = 4
Streak condition = At least
Target probability = 29.8828125%
Number of flips = unknown
27.24609375%
29.8828125%
32.421875%
Results are rounded for display.
Internal calculations use full precision.
Calculations Disclaimer
Why Can a Long Coin Streak Feel Rarer Than It Really Is?
A surprising streak often creates the same problem. Someone sees repeated heads and suspects something unusual. The Coin Toss Streak Calculator gives that intuition a numerical test. The Coin Toss Streak Calculator measures runs across an entire sequence, not one isolated position.
This distinction changes almost everything. A chosen sequence of several heads has one starting position. A streak inside a longer experiment may start in many places. Those possible starts are not independent. They can overlap. That overlap makes simple mental arithmetic unreliable.
Randomness also looks less tidy than many people expect. People often imagine a random sequence alternating frequently. Real random sequences can cluster. Several heads may appear together. Several tails may follow. Neither pattern requires the coin to remember earlier results.
The Difference Between Total Heads and Consecutive Heads
A common mistake begins with the wrong question. Total-head probability asks how many heads appear. Streak probability asks where those heads appear. The same head count can create very different run lengths.
Consider two sequences with equal totals. One may place the heads together. Another may separate every head with a tail. Their total-head statistics can match. Their longest streaks cannot.
This is why a standard head-count calculation cannot replace streak analysis. The order carries essential information. Removing that order destroys the feature being measured.
A streak calculator therefore studies sequence structure. It tracks the longest unbroken block of heads. It then compares that block with the threshold selected by the user.
Why Order Changes the Probability
Every position belongs to a sequence. Moving one tail can break a long run into two shorter runs. Moving one head can join nearby runs. The total number of heads may remain unchanged.
This small change can move a sequence between result categories. It may stop satisfying an exact target. It may begin satisfying an at-least target. It may also cross an at-most boundary.
That sensitivity makes streak probability useful for teaching randomness. It shows why arrangements matter. It also exposes a common weakness in human intuition. We see clusters and instinctively search for a cause.
The better question is mathematical. How often should this pattern appear under the stated model? AxiCalculator turns that question into a direct probability result.
What Does a Coin Toss Streak Calculator Actually Measure?
A real problem appears when users say “three heads in a row.” That phrase can describe several different events. The longest run may equal three. It may be at least three. It may be no more than three.
Those questions sound similar. Their probabilities are different. A reliable calculator must keep them separate.
Exactly This Long: Reading an Exact Longest Streak
An exact result has a strict meaning. The longest head run must equal the selected length. A longer run does not qualify.
This point matters. A sequence containing four consecutive heads also contains smaller blocks inside it. However, its longest run is four. It does not belong to the exact-three category.
Exact mode is useful when the maximum observed run matters. It divides all possible sequences into distinct longest-run classes. Each complete sequence belongs to only one exact class.
At Least This Long: Measuring a Threshold Event
At-least mode asks whether the sequence reaches a threshold. Longer streaks remain acceptable. A run of six satisfies an at-least-four requirement.
This type of question is often the most intuitive. Users want to know whether a streak of a chosen size appears anywhere. The answer includes every sequence that reaches or exceeds that threshold.
As the threshold rises, qualifying sequences become less common. As the flip count grows, more opportunities appear. Those two effects work in opposite directions.
At Most This Long: Measuring a Maximum Streak
At-most mode asks whether the sequence stays below a ceiling. Every valid sequence must avoid a run longer than the selected limit.
This view is mathematically powerful. Counting sequences that avoid a forbidden long run can be easier. Once that cumulative probability is known, other streak modes follow naturally.
The three modes therefore describe one distribution from different angles. Exact mode isolates one longest-run length. At-least mode collects the upper tail. At-most mode collects the lower portion.
Why Does Simple 0.5 to the Power k Fail for a Whole Sequence?
A frequent real-world mistake starts with a familiar calculation. A user knows each fair toss has a one-half chance of heads. They multiply those chances for a short run. That calculation answers a valid question, but often not the intended one.
A Fixed Window Is Not the Same as Anywhere in n Flips
A fixed window has a known starting point. The required heads must occupy those specific positions. The calculation is straightforward because there is only one location.
A whole sequence creates many possible locations. A qualifying streak may begin early, late, or somewhere in the middle. A longer streak can contain several shorter qualifying windows.
This makes the whole-sequence event larger than one fixed-window event. It also makes direct multiplication by the number of positions unsafe.
Why Adding Window Probabilities Can Double-Count Outcomes
Suppose adjacent starting positions are considered separately. One long block of heads can satisfy both positions. Adding their probabilities directly counts that same sequence more than once.
The problem grows with longer experiments. Streak windows overlap heavily. A simple sum can eventually produce impossible reasoning, including totals beyond one.
Sequence counting avoids that trap. Instead of treating every window as independent, it classifies entire outcomes. Each complete outcome is counted under the appropriate condition.
This is the central reason a dedicated streak calculator is valuable. It manages overlap automatically. The user does not need to construct a complicated inclusion-exclusion argument.
The practical benefit is clarity. Enter the total flip count. Choose the streak relationship. Enter the streak length. The result then refers to the complete sequence rather than one selected window.
How Does Sequence Counting Handle Overlapping Streaks?
The difficult part is not flipping the coin. The difficult part is counting valid sequences without duplication. Listing every sequence works only for tiny experiments. The number of possible outcomes doubles with every additional toss.
Building Valid Coin Sequences With a Recurrence
A more efficient idea looks at how a valid sequence can begin or end. A tail breaks the current head streak. That reset allows the remaining positions to behave like a shorter version of the same problem.
The calculator can reuse earlier counts. It does not need to rebuild every full sequence. This repeated structure creates a recurrence.
Each new sequence count depends on several previous counts. The number of previous terms depends on the maximum allowed head run. This produces an efficient dynamic process.
The approach also preserves exact integer sequence counts. That matters because the underlying sample space is discrete. Every fair-coin sequence has the same probability under the model.
Why k-Step Fibonacci Behavior Appears
Many users recognize the ordinary Fibonacci sequence. Streak counting produces a broader relative. Instead of adding only two previous terms, the calculation may add several.
The number of required previous terms depends on the streak boundary. This creates a family often described through multi-step Fibonacci behavior.
The label is useful, but the logic matters more. The recurrence counts sequences that remain within the allowed run limit. It does so without enumerating the full sample space.
Moving From Cumulative Probability to Exact Probability
A cumulative result answers whether the longest run remains below a boundary. Exact probability compares neighboring boundaries. At-least probability uses the complementary side of a boundary.
This shared structure keeps the modes consistent. They are not separate calculators with unrelated logic. They are different views of the same longest-run distribution.
That consistency matters during comparison. A user can switch modes without changing the underlying experiment. Only the event being queried changes.
How Should You Read a Streak Without Falling for the Gambler’s Fallacy?
A common practical problem appears after a dramatic streak. Someone sees repeated heads and feels tails must now be due. That reaction sounds reasonable. It is incorrect under independent fair tosses.
Why the Next Fair Toss Still Has a 50% Head Probability
Past results do not alter a new independent toss. The coin has no memory. Previous heads do not create a debt that future tails must repay.
This does not make the earlier streak ordinary. A complete long sequence may have a small probability before the experiment begins. However, once the earlier flips are already known, they are history.
The next unresolved toss still follows the same single-toss probability. Confusing these two questions creates the gambler’s fallacy.
The distinction becomes easier when time is separated. Before flipping, ask about the probability of an entire future pattern. After observing a streak, ask about the next independent toss. Those are different events.
Rare Sequences Do Not Automatically Prove a Biased Coin
Another problem appears when a streak looks “too clean.” People may treat one surprising run as proof of unfairness. That conclusion is stronger than the observation supports.
Random processes can generate visually unusual clusters. Large experiments create more chances to see them. A single run therefore needs context.
Testing fairness is a different statistical task. It requires enough observations and an appropriate test. Longest-run probability can inform that investigation, but cannot replace it.
This is one reason result interpretation matters. The calculator measures probability under its chosen model. It does not convert surprise into proof.
How Does Streak Probability Change as the Number of Flips Grows?
A planning problem often begins with two variables. Users can change the total flips or the required streak. These changes push probability in different directions.
More Flips Create More Places for a Streak to Begin
Keeping the streak threshold fixed while adding flips creates more opportunities. A qualifying run can appear in more locations. The at-least probability therefore tends to rise.
The growth is not simply linear. New possible starting positions overlap with existing positions. Recurrence counting handles those dependencies.
For short experiments, one extra toss can change the available sequence set noticeably. In larger experiments, the same extra toss may change the final percentage less dramatically.
This sensitivity is useful for planning probability demonstrations. It helps answer how long an experiment must become before a chosen streak stops looking unusual.
Comparing Exact, At Least, and At Most Results
The three modes move differently. At-least values accumulate longer streaks. At-most values accumulate shorter streaks. Exact values isolate a narrow class between them.
An exact probability can rise and later fall as flips increase. More flips initially create opportunities for the target longest run. Eventually, longer runs become more common too.
This behavior surprises users expecting every probability to move monotonically. It reflects the difference between a threshold event and a single distribution category.
Reading the selected mode first prevents confusion. The same streak length can produce three valid but very different percentages.
How Can You Reverse Solve From a Target Streak Probability?
Sometimes the unknown is not probability. A user may know the desired chance and streak length. They want the number of flips that produces that chance.
That problem cannot always be solved with simple algebra. The unknown is an integer, and streak probabilities arise from discrete sequence counts.
Why Reverse Streak Results Are Discrete
Changing from one flip count to the next changes the sample space in steps. The probability therefore moves through a set of attainable values.
A target may match one supported integer exactly. Another target may sit between two attainable values. A responsible reverse solver must recognize the difference.
AxiCalculator searches supported integer candidates under the selected relation. It compares their streak probabilities with the target. A unique valid match can then be returned.
This approach preserves the meaning of the original calculation. Reverse solving uses the same model rather than inventing a continuous approximation.
When a Rounded Probability Can Match Multiple Inputs
Displayed percentages can hide small differences. Two underlying probabilities may appear identical after limited decimal precision. Reverse solving then becomes ambiguous.
Choosing one candidate silently would create false certainty. A better result reports that multiple matches remain possible. The user can provide more precision or another known input.
This is especially important near probabilities that change slowly. Additional flips may cause only small displayed changes. Exact internal comparison reduces avoidable errors.
Reverse calculation is therefore a search problem with validation. It is not merely the forward equation written backward.
Which Mistakes Most Often Distort Coin Streak Probability?
The most damaging mistake is answering a different question. Users may calculate total heads when they need consecutive heads. They may calculate one fixed block when they need a block anywhere.
Another mistake is treating overlapping windows as independent. They are not. One long run can satisfy several neighboring windows at once.
A third mistake involves language. “Exactly three consecutive heads” may mean two different things. It can mean one selected three-flip block. It can also mean the longest run equals three. The calculator uses the longest-run interpretation when exact streak mode is selected.
Another error occurs after observing a streak. Users sometimes change the next-flip probability because of previous outcomes. Independent fair tosses do not behave that way.
Simulation creates another source of confusion. A simulation result is an estimate. Different random samples can produce different percentages. Exact recurrence calculations do not have that sampling noise.
Finally, users may treat a rare event as impossible. Probability does not work that way. Low-probability events remain possible. Large numbers of opportunities can also make surprising patterns much easier to encounter.
The safest workflow starts by defining the event precisely. Identify the number of flips. Define the longest-run condition. Choose exact, at least, or at most. Then read the result within that definition.
That discipline removes most errors before any mathematics begins.
Where Is Longest-Run Analysis Useful Beyond Classroom Coin Problems?
A practical problem may involve more than coins. Many systems generate binary outcomes. They record success or failure, pass or fail, hit or miss, or event and non-event.
Runs can help describe clustering inside those sequences. A long success run may be interesting. A long failure run may be operationally important. The same mathematical idea appears whenever consecutive binary outcomes matter.
Quality-control sequences provide one example. A process may record acceptable and unacceptable observations. Reliability studies may track working and failed cycles. Digital experiments may store conversion and non-conversion events.
However, the model must fit the data. Real systems may have changing probabilities. Outcomes may depend on earlier outcomes. In those cases, a fair independent coin is only a teaching reference.
This distinction protects interpretation. The calculator is strongest when its model matches the question. It is also useful as a benchmark when comparing more complex systems.
For students, longest-run analysis connects simple coin tossing with deeper probability ideas. It introduces recurrence, discrete distributions, dependence between overlapping events, and cumulative probability.
For analysts, it offers a reminder about clustering. Random data can produce patterns that look meaningful. A visual streak alone does not explain its cause.
For educators, the tool creates immediate feedback. Change the total flips and watch the probability respond. Change the streak length and see how quickly the event changes.
AxiCalculator makes these comparisons immediate. The arithmetic stays hidden until deeper detail is needed. The user can focus first on the question, then inspect the reasoning.
That order matters. Good probability tools should reduce confusion before adding theory. They should make the event clear, show the result quickly, and support verification when needed.
Frequently Asked Questions
Can two coin sequences have the same number of heads but different streak probabilities?
Why can an exact longest streak become less likely when I keep adding more flips?
Does changing from heads to tails change the answer for a fair coin?
Why can a random sequence contain several long-looking patterns?
How should an analyst validate a streak model when observations are not independent?
Can longest-run probability replace a formal randomness test?
Why is dynamic programming preferable to enumerating every sequence for larger n?
Engineering Resources
Our engineers are here to help you get it right.