Risk Calculator
- Last formula update:

Decimal & Rounding Policy
Valid range

Wylena Brantford
Reviewers:
Valdren Clyforde
Zenara Dentwick
Check our editorial policy
September 20, 2026
1.0.0
Initial calculator and formula release.
Our engineers are here to help you get it right.
How Does a Risk Calculator Help You Make a Better Decision?
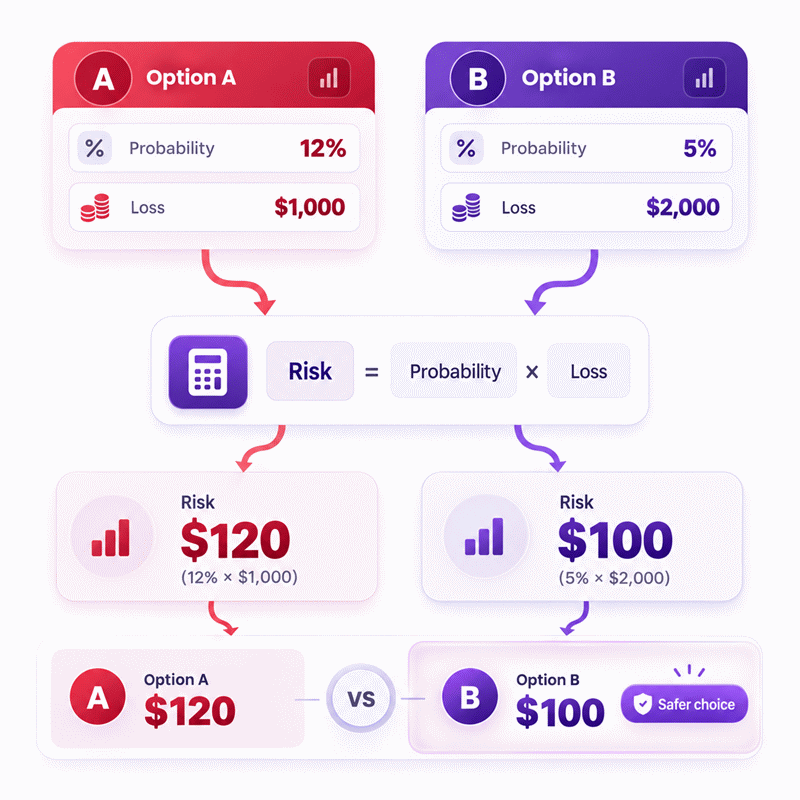
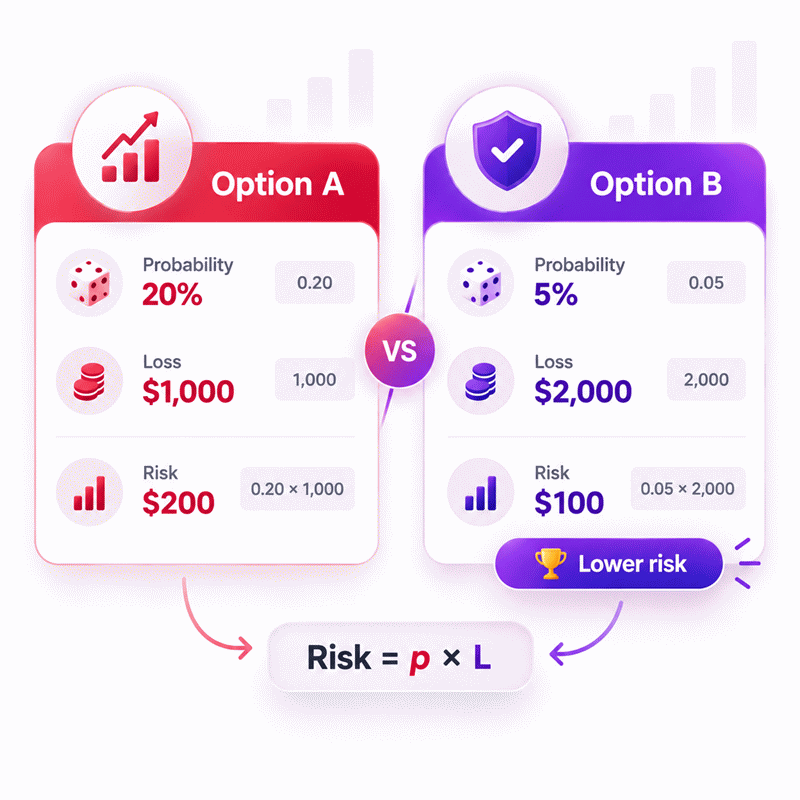
Risk Calculator results turn the likelihood and financial consequence of a defined failure into a clear comparison between uncertain options. The tool is most useful when you need to see whether a lower failure rate truly means lower financial exposure or whether a larger potential loss changes the decision.
- Compare two options using the same downside framework.
- See why low probability does not always mean low financial exposure.
- Use reverse solving when one connected value is unknown.
- Challenge probability and loss estimates before trusting a close result.
- Test alternative assumptions when the decision is sensitive.
- Separate expected downside from the full loss that could actually occur.
- Consider return, liquidity, resilience, and other factors before a final decision.
A Risk Calculator supports structured decisions; it does not predict the exact future. A strong decision uses the result together with credible input data, realistic consequences, sensitivity checks, and an understanding of what the organization can actually afford to lose.
Assumptions used in this calculator
- Probability represents the estimated chance of the defined failure event.
- Probability remains between zero and one hundred percent.
- Loss represents monetary damage only if the defined failure occurs.
- Risk equals probability multiplied by loss for the same scenario.
- Loss and risk use the same monetary unit within each calculation.
- Potential profits are excluded from the risk estimate.
- Investment returns are not included in the comparison.
- Each option is evaluated independently using its own inputs.
- Input probabilities are estimates, not guarantees of future outcomes.
- Loss values should reflect realistic exposure for the failure event.
- Reverse solving assumes the remaining known values are valid.
- Zero denominators are treated as undefined in reverse calculations.
- Intermediate calculations retain full precision before display rounding.
Results are rounded for display.
Internal calculations use full precision.
Formulas Used in Risk Calculator :
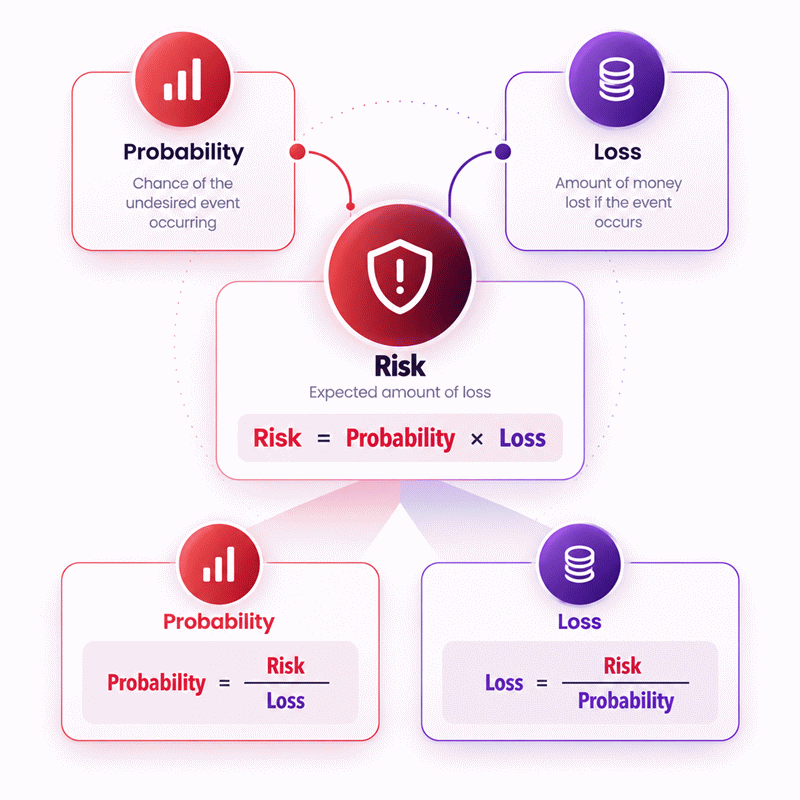
Forward Risk Calculation
Reverse Probability Calculation
Reverse Loss Calculation
- R
- Risk, expressed in the same monetary unit as the loss.
- p
- Probability of failure expressed as a decimal from 0 to 1.
- L
- Monetary loss incurred if the defined failure occurs.
- A percentage probability is converted to decimal form before calculation.
- Loss and risk must use dimensionally compatible monetary units.
- Intermediate values retain full precision before final display rounding.
- Reverse division is performed only when the denominator is greater than zero.
Variables & Definitions
View a complete list of all variables used in this calculator, including definitions and units
Risk Calculator Variables and Definitions
| Variable | Name | Definition | Valid Range | Unit |
|---|---|---|---|---|
| R | Risk | Expected monetary exposure associated with the defined failure scenario. | 0 to supported finite maximum | Monetary unit |
| p | Probability of failure | Estimated likelihood that the defined failure event will occur. | 0 to 1, equivalent to 0% to 100% | Decimal probability or percentage |
| L | Loss | Monetary amount lost if the defined failure event occurs. | 0 to supported finite maximum | Monetary unit |
Unit Conversion Table
Probability Unit Conversion Table
| Unit Group | Unit Name | Symbol | Equivalent in Decimal Probability | Used For |
|---|---|---|---|---|
| Popular Units | Percent | % | 1% = 0.01 | Standard user-facing probability input |
| Popular Units | Decimal probability | 1 | 1 = 1 | Direct probability used by the calculation formula |
| Scientific Units | Per mille | ‰ | 1‰ = 0.001 | Low-probability technical and statistical values |
| Scientific Units | Basis point | bp | 1 bp = 0.0001 | Small probability changes and financial risk rates |
Monetary Scale Conversion Table
| Unit Group | Unit Name | Symbol | Equivalent in USD | Used For |
|---|---|---|---|---|
| Popular Units | US dollar | USD | 1 USD | Standard loss and risk values |
| Popular Units | Thousand US dollars | k USD | 1,000 USD | Medium financial exposures |
| Popular Units | Million US dollars | M USD | 1,000,000 USD | Large business and investment exposures |
| Scientific Units | Billion-scale US dollars | 1e9 USD | 1,000,000,000 USD | Very large institutional exposures |
| Scientific Units | Trillion-scale US dollars | 1e12 USD | 1,000,000,000,000 USD | Extremely large aggregate exposures |
Example Calculation
Option B risk: 3,640 USD
Difference: 70 USD
Lower calculated risk: Option A
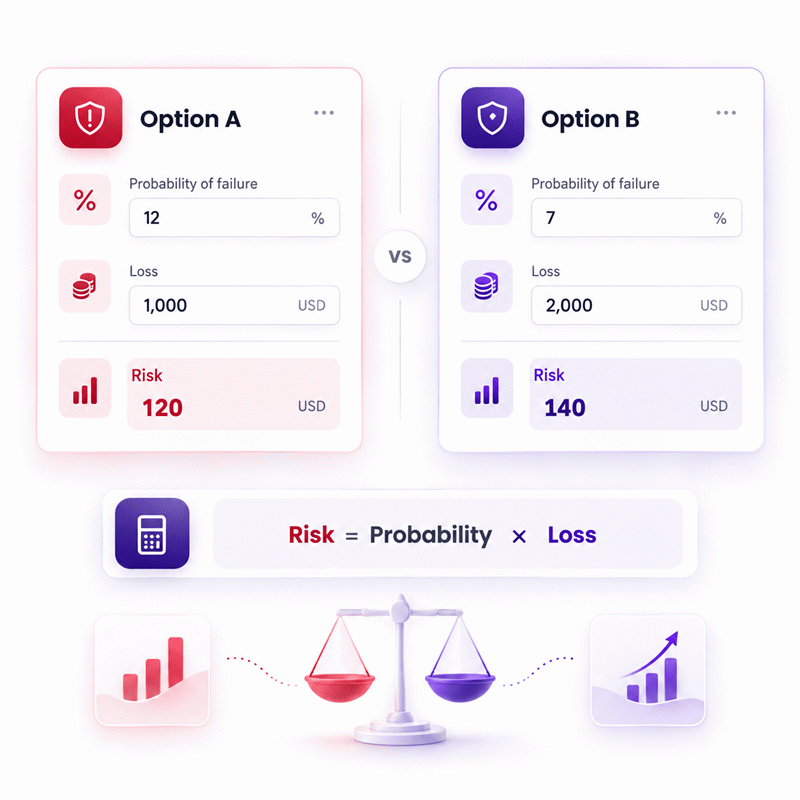
Option B has the lower probability of failure, but its possible loss is substantially larger. Multiplying probability by loss gives an expected monetary risk of 3,570 USD for Option A and 3,640 USD for Option B. Option A therefore has the lower calculated risk by 70 USD under these assumptions. This comparison evaluates downside exposure only and does not include potential profit or return.
Probability = 4,950 / 90,000
Probability = 0.055 = 5.5%
In this reverse calculation, risk and loss are known while probability is unknown. Dividing the 4,950 USD risk by the 90,000 USD possible loss gives a decimal probability of 0.055. Converting 0.055 to percentage form produces a failure probability of 5.5%. The reverse result is valid because the loss is greater than zero and the calculated probability remains within 0% to 100%.
Results are rounded for display.
Internal calculations use full precision.
Calculations Disclaimer
What Does a Risk Calculator Actually Tell You?
A decision can look safe until one possible failure is given a real financial value. That is where a Risk Calculator becomes useful. It turns two parts of uncertainty into one comparable measure. The result helps you see how much financial exposure is linked to a defined failure event. It does not tell you what will certainly happen. It gives you a consistent way to compare choices that would otherwise depend on instinct.
This distinction matters in real decisions. A manager may prefer an option because failure seems unlikely. An investor may focus only on the money that could be lost. Both views are incomplete on their own. One ignores consequence. The other ignores likelihood. A risk result brings those two ideas together so they can be considered on the same scale.
The number becomes most useful when two options solve the same problem. Imagine one supplier has a reliable record but a severe replacement cost. Another has more frequent failures but cheaper recovery. Looking only at reliability may favor the first supplier. Looking only at replacement cost may favor the second. A structured risk comparison shows whether either factor is large enough to change the decision.
Why Expected Exposure Is Not the Loss You Will Definitely Experience
A common mistake is reading the result as a future invoice. It is not. A calculated exposure of 500 monetary units does not mean a failure will cost exactly 500. The actual event may never happen. If it happens, the real loss may be much larger than the displayed exposure.
Think of the number as a common comparison scale. It is useful because different combinations of likelihood and consequence can be compared without hiding either factor. This makes it easier to rank choices, discuss risk with a team, and identify assumptions that deserve closer review.
The result becomes less useful when people forget the event behind it. A rare failure with a huge consequence can have the same calculated exposure as a common failure with a small consequence. Those situations are not operationally identical. One may require insurance, redundancy, or emergency capacity. The other may simply require a routine operating allowance. The same number can therefore support different actions.
When a Single Risk Number Helps You Decide Faster
The method works best when the possible failure is clearly defined. The two options should also be comparable. If success means something completely different for each choice, a downside-only comparison can hide important value.
A practical use is early screening. You can compare several choices and identify which ones deserve deeper review. This saves time because detailed analysis can focus on the decisions where uncertainty could materially change the outcome.
Decision shortcut: use the risk result to find the next question, not to end the analysis.
Why Can a Lower Failure Probability Still Produce Higher Financial Risk?
A buyer sees two offers. The first has more reported failures. The second appears more reliable. The obvious reaction is to choose the second. Then the recovery cost is examined. A failure in the second option could cost several times more. The apparently safer choice may now create greater financial exposure.
This is one of the most useful insights in risk analysis. Probability cannot be judged without consequence. A small chance of a very large loss may deserve more attention than a larger chance of a trivial loss. The reverse can also be true.
The Hidden Tradeoff Between Likelihood and Consequence
People often give too much weight to the factor that feels easier to understand. A percentage looks precise. A large monetary figure looks dramatic. Neither should dominate the decision automatically.
Instead, ask two separate questions. How credible is the estimated likelihood? How realistic is the estimated consequence? If either answer is weak, the final comparison is weak. Better arithmetic cannot repair poor assumptions.
This creates a useful decision habit. When two options are close, challenge the inputs. Ask what would need to change before the preferred option changes. A decision that survives reasonable changes is more robust. A decision that flips after a tiny assumption change deserves more investigation.
Low Probability, High Consequence Decisions
Rare failures deserve special attention when recovery could threaten cash flow, safety, production, or business continuity. The average exposure may look manageable while the full consequence remains difficult to absorb. This is why a low result should never erase the need to examine the event itself.
For a business, this could involve a critical supplier, a major equipment failure, a contract penalty, or a long service interruption. The decision is not only about how often failure might occur. It is also about whether the organization can survive the failure comfortably.
High Probability, Low Consequence Decisions
Frequent small failures create a different problem. They may not threaten the business, but they can produce recurring costs, staff frustration, delays, and process waste. A low individual consequence can become meaningful when similar events happen repeatedly.
The calculator helps frame the financial side. Operational teams should then decide whether prevention costs less than tolerating the repeated problem.
LIKELIHOOD rises → exposure tends to rise.
CONSEQUENCE rises → exposure tends to rise.
BOTH rise → attention becomes more urgent.
ONE falls while the other rises → compare before deciding.
How Should You Compare Two Risky Options Without Being Misled?
A procurement team receives two proposals with similar performance. One has a lower purchase price. The other has stronger reliability. A quick decision based on price alone can ignore failure exposure. A decision based only on reliability can ignore the cost of failure. The comparison must stay tied to the actual business objective.
Start With the Downside That Could Actually Happen
Define failure before estimating anything else. “The project goes badly” is too vague. “The supplier misses the required delivery window and causes a production interruption” is more useful. A clear event makes both likelihood and financial consequence easier to estimate.
Next, keep the scope consistent. If one option includes only replacement cost while another includes replacement, labor, and downtime, the comparison is biased. Each option should reflect the same consequence boundary.
This step often improves the decision more than adding extra decimal places. Clear scope removes hidden differences that can make precise numbers misleading.
Look Beyond the Smaller Number Before You Decide
The option with lower calculated exposure deserves attention, but it does not automatically deserve the contract, investment, or budget. Check what the simple comparison leaves out. One choice may provide much higher value when successful. Another may create liquidity pressure. A third may be harder to exit after problems appear.
These factors do not invalidate the calculator. They define its job. The tool answers a focused downside question. The decision maker must place that answer inside the wider business context.
When Two Options Have Nearly Equal Exposure
A near tie is useful information. It means the simple risk metric does not strongly separate the choices. Instead of forcing a winner, compare the factors that the metric does not measure.
Consider recovery time, available cash, operational flexibility, strategic value, supplier dependency, and the quality of the underlying estimates. A near tie can also signal that better information is worth paying for.
A close result is not a failed calculation. It is a signal that another factor should decide.
How Can Better Inputs Improve Your Risk Decision?
A team can calculate perfectly and still reach a poor conclusion. This happens when the inputs look precise but have weak evidence behind them. The most important improvement is often not a better calculator. It is a better estimate.
Build Probability Estimates From Relevant Evidence
Historical data is useful when past conditions resemble the current decision. A failure rate from another product, market, supplier, climate, or operating environment may not transfer well. Recent data may also deserve more weight when systems have changed.
When clean data is unavailable, document the reasoning behind the estimate. A range can be more honest than a single exact percentage. Teams can then test several plausible values and observe whether the preferred choice changes.
Independent estimates can also reveal hidden confidence. If three experienced people produce very different probability estimates, the disagreement itself is valuable. It shows that uncertainty is higher than one neat percentage suggests.
Estimate Financial Consequences Without False Precision
Loss estimates can fail for the same reason. The visible replacement price may represent only part of the consequence. Downtime, labor, logistics, penalties, disposal, rework, lost production, and contract effects may also matter.
At the same time, adding every imaginable secondary cost can exaggerate the downside. Define a reasonable boundary and use it consistently. The goal is not to produce the largest possible number. The goal is to create a defensible comparison.
Why Outdated Assumptions Can Reverse Your Decision
Risk is not frozen. Supplier performance changes. Prices change. Contracts change. Equipment ages. New controls reduce failure rates. New dependencies increase consequences.
A result that supported a decision six months ago may no longer support it today. Recalculate when important assumptions change. Keep enough documentation to understand why an old result differed from a new one.
BETTER DECISION FLOW
Define the failure → Gather evidence → Estimate likelihood → Estimate consequence → Compare options → Challenge assumptions → Make the decision → Review when conditions change.
Where Is a Probability-and-Loss Risk Calculator Most Useful?
A business does not need an advanced model for every uncertain choice. Sometimes the decision is narrow. There is a clear failure event, a reasonable estimate of its chance, and a measurable financial consequence. In that situation, a focused calculator can save time without hiding the basic logic.
Investment Screening and Capital Decisions
Early investment screening often involves several options competing for limited attention. A downside comparison can expose choices where a modest expected return comes with disproportionate failure exposure.
This does not replace portfolio analysis or investment research. It gives the analyst one additional lens. Used well, it can highlight where deeper due diligence is justified.
Supplier, Procurement, and Contract Decisions
Procurement decisions often contain measurable failure events. A component may arrive late. A vendor may fail a quality target. A contractor may miss a milestone. Each event can create financial consequences.
A consistent risk comparison gives procurement teams a common way to discuss those choices. It also makes assumptions visible. Instead of saying one supplier “feels safer,” the team can explain what likelihood and consequence estimates support that view.
Project and Operational Risk Reviews
Projects face many uncertain events, but a focused calculation can still help prioritize them. Teams can identify which threats deserve more detailed response planning and which can be monitored with less effort.
Operational teams can use the same approach for maintenance, process failures, service interruptions, or recurring quality problems. The important requirement is a clearly defined event and a consequence that can be represented meaningfully.
The calculator is most valuable when it turns a vague concern into a question you can test.
When Can a Simple Risk Number Give You False Confidence?
A neat number feels authoritative. That feeling becomes dangerous when the model is simpler than the real decision. The result can still be mathematically correct while the interpretation is incomplete.
The Problem With Rare but Severe Events
A very unlikely event can produce a modest average exposure even when the full consequence would be catastrophic. Decision makers should therefore examine both the weighted result and the event consequence itself.
This matters when the organization has limited capacity to absorb a loss. A company that could comfortably handle repeated small losses may be unable to survive one extreme event. The average alone cannot express that difference.
Why Correlated Risks Need More Than One Calculation
Simple comparisons work best when the defined event can be treated separately. Real projects often contain connected risks. A supplier delay may cause overtime, which may increase quality problems, which may create further delay.
Calculating each event as if it were independent can hide those connections. When several risks can trigger or amplify one another, scenario analysis or simulation may provide a better picture.
When Potential Upside Changes the Decision
A downside calculator intentionally focuses on loss. That is useful, but investments and business choices often include different potential returns. A higher-risk option may still be attractive if its expected benefits are materially greater and the downside is affordable.
Keep those questions separate. First understand the downside. Then compare the upside using a method designed for returns and multiple outcomes. Mixing the two without a clear framework can make the decision harder to explain.
How Can Sensitivity Thinking Make Your Decision More Resilient?
A decision looks clear until someone asks, “What if that estimate is wrong?” That question should not be treated as an attack on the analysis. It is one of the most useful tests available.
Test What Happens When Probability Changes
Try a lower and higher plausible likelihood. If the same option remains preferable, the decision has some resilience to probability uncertainty. If the preferred option changes quickly, better evidence may be worth collecting.
The goal is not to guess every possible future. It is to understand which assumption controls the decision.
Test What Happens When the Potential Loss Changes
Repeat the process with consequence estimates. This is useful when repair costs, downtime, penalties, or recovery expenses are uncertain.
A decision that survives a reasonable consequence range is easier to defend. A decision that changes after a small adjustment should be described as sensitive rather than certain.
Recognize a Decision That Is Too Sensitive to Trust
When tiny input changes repeatedly reverse the preferred option, the apparent numerical winner is weak. More research, a pilot, a contractual safeguard, insurance, or an alternative structure may provide more value than another round of arithmetic.
This is a powerful use of AxiCalculator. The tool can be used not only to produce one result, but also to explore what would need to change before the decision changes.
How Should You Turn a Risk Result Into a Real Decision?
A calculated result becomes useful only when it changes what someone does. The final step is therefore interpretation. Do not stop at “Option A is lower.” Ask why it is lower, whether the assumptions are credible, and whether the possible full loss is acceptable.
Separate Numerical Comparison From Risk Tolerance
Two organizations can see the same numbers and make different choices. One may have enough cash, insurance, or redundancy to absorb a severe loss. Another may not. Risk tolerance belongs to the decision maker, not to the arithmetic.
This distinction prevents false certainty. The calculator can compare exposure. It cannot decide how much uncertainty an organization should accept.
Document the Assumptions That Matter
Record the event definition, evidence behind the probability estimate, consequence boundary, date of the analysis, and major exclusions. This makes the result easier to review later.
Good documentation also improves teamwork. A disagreement can focus on an assumption rather than on the calculator itself. If new evidence appears, the team knows exactly which input to update.
Know When a More Advanced Risk Model Is Required
Move beyond a simple probability-and-loss comparison when the decision contains many outcomes, dependent risks, uncertain distributions, changing cash flows, or severe tail events. More complexity is justified when it materially changes the decision.
For focused comparisons, however, simplicity is a strength. AxiCalculator gives you a fast way to expose the tradeoff between likelihood and consequence. Use the result as a disciplined starting point, test the assumptions that matter, and move to a richer model only when the decision truly requires one.
Ready to compare two uncertain choices? Use the AxiCalculator Risk Calculator, enter the information you already know, and test how your decision changes as the scenario changes.
Frequently Asked Questions
What does the result from this Risk Calculator represent?
Why can an option with a lower failure probability still have higher risk?
Should I always choose the option with the lower calculated risk?
How can I make my Risk Calculator result more reliable?
What should an engineer do when probability and consequence estimates are both uncertain?
Why can two risks with equal calculated exposure require different mitigation strategies?
When should I move from this calculator to a more advanced risk model?
Engineering Resources
Our engineers are here to help you get it right.