Protein Concentration Calculator
- Last formula update:
Decimal & Rounding Policy
- Calculations use full internal precision and are rounded only for display.
- Protein concentration results are shown with up to 6 decimal places, with unnecessary trailing zeros removed.
- Absorbance, extinction coefficient, molecular weight, pathlength, and dilution factor are never rounded before the final calculation.
- Very small or very large results may use scientific notation to keep values clear and readable.
- Unit conversions are performed before display rounding to preserve calculation accuracy.
Valid range
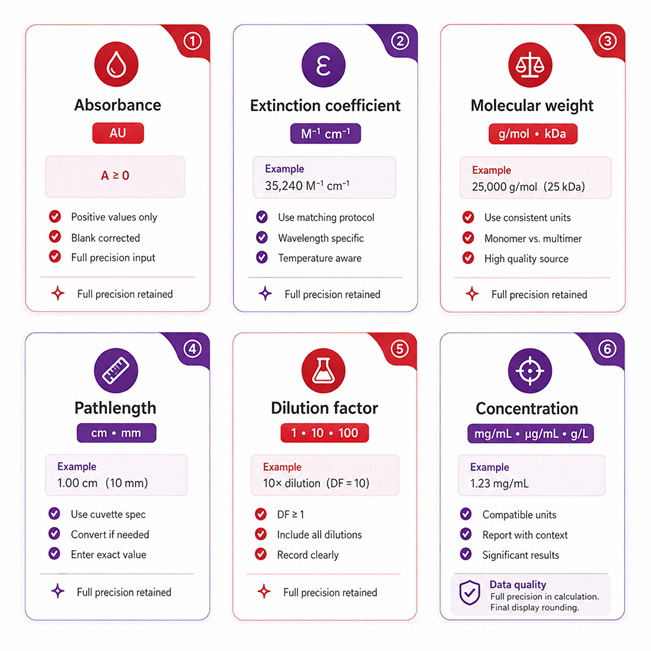
- Absorbance: Use values greater than or equal to 0 and within the reliable measurement range of the spectrophotometer.
- Extinction coefficient: Enter a positive value greater than 0 in a compatible molar extinction unit.
- Molecular weight: Enter a positive protein molecular weight greater than 0.
- Pathlength: Use a positive optical pathlength greater than 0.
- Dilution factor: Use 1 for an undiluted sample and values greater than 1 for diluted samples.
- Protein concentration: Valid calculated concentrations must be greater than or equal to 0.

Olivara Dremmont
Reviewers:
Urellyn Vexmere
Ralven Pexthorne
Check our editorial policy
August 29, 2026
1.0.0
Initial calculator and formula release.
Our engineers are here to help you get it right.
How Does a Protein Concentration Calculator Turn A280 Absorbance Into a Reliable Result?
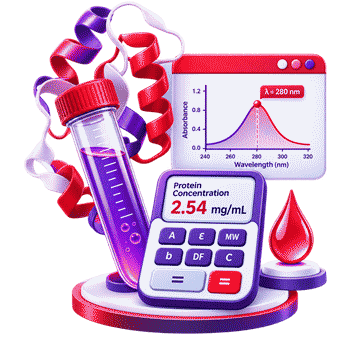
Protein Concentration Calculator turns an A280 absorbance measurement into a practical estimate of protein concentration by applying the Beer-Lambert relationship with protein-specific and experimental data. The calculation considers absorbance, molar extinction coefficient, molecular weight, optical pathlength, and dilution factor so the result reflects the measured sample and its preparation conditions.
- A280 works best with purified proteins and reliable protein-specific optical data.
- The extinction coefficient must match the protein and measurement wavelength.
- Molecular weight connects molar concentration with useful mass concentration.
- Pathlength must match how the spectrophotometer reports the absorbance reading.
- Dilution must be included when reporting the original sample concentration.
- Reverse solving can determine a missing absorbance or other supported parameter.
- DNA, RNA, detergents, turbidity, and absorbing buffers can distort A280 measurements.
- A matching blank helps remove background absorbance from the measurement.
- Unexpected results should trigger input and sample-quality checks before acceptance.
The Protein Concentration Calculator is most useful when calculation and laboratory context are considered together. Clean samples, correct protein data, suitable optical conditions, and careful measurement provide the strongest basis for a meaningful result. Reverse solving also supports experiment planning, dilution checks, and troubleshooting when one calculation parameter is unknown.
Assumptions used in this calculator
- Absorbance is measured at a wavelength appropriate for the selected protein.
- The extinction coefficient matches the protein, wavelength, solvent, and measurement conditions.
- Molecular mass represents the same protein species used for absorbance measurement.
- Pathlength reflects the effective optical distance through the measured sample.
- Dilution factor accurately represents all sample dilution performed before measurement.
- Undiluted samples use a dilution factor of one.
- Beer-Lambert behavior is assumed within the instrument’s reliable linear range.
- Samples are sufficiently clear to minimize scattering and optical interference.
- Background and blank absorbance corrections are performed when laboratory procedures require them.
- Input units are dimensionally compatible and converted before the concentration calculation.
- Intermediate calculations retain full precision before final display rounding.
- Calculated concentration applies to the original sample after dilution correction.
- Results require laboratory verification before industrial, regulatory, clinical, or safety-critical use.
Results are rounded for display.
Internal calculations use full precision.
Formulas Used in Protein Concentration Calculator :
1. Unit Normalization
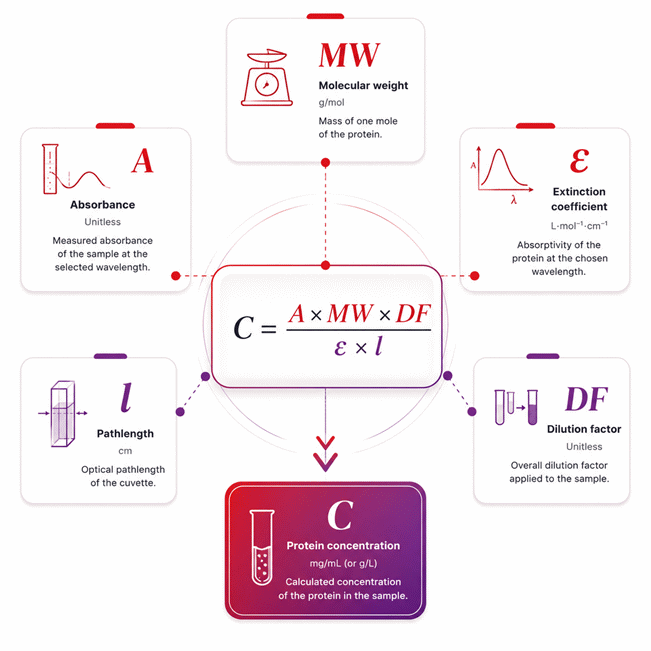
2. Protein Concentration
- qinput = value entered or displayed in the selected unit.
- kunit = conversion factor from the selected unit to the calculator base unit.
- qbase = normalized physical value used internally for calculation.
- C = protein mass concentration.
- A = measured absorbance at the selected wavelength; absorbance is dimensionless.
- ε = molar extinction coefficient, typically expressed in M-1 cm-1.
- b = optical pathlength through the sample, typically expressed in cm.
- m = molecular mass of the protein, typically expressed in g/mol.
- n = dimensionless dilution factor; use 1 for an undiluted sample.
3. Calculation Direction
The calculator uses the same protein concentration relationship for both forward and reverse calculations. When one supported variable is unknown and the remaining required values are known, the same equation is algebraically solved for that unknown without changing the calculation model. Unit conversion is completed before solving, intermediate values retain full numerical precision, and rounding is applied only to the displayed result.
Variables & Definitions
View a complete list of all variables used in this calculator, including definitions and units
Protein Concentration Calculator Variables and Units
| Symbol | Variable | Typical Unit | Description |
|---|---|---|---|
| qinput | Entered Value | Selected unit | The numerical value entered or displayed using the currently selected unit. |
| kunit | Unit Conversion Factor | Dimension-dependent | The factor used to convert a selected unit into the calculator's corresponding base unit. |
| qbase | Normalized Value | Base unit | The normalized physical value used internally before the concentration calculation is performed. |
| C | Protein Concentration | mg/mL | The calculated mass concentration of protein in the original sample after applying the dilution factor. |
| A | Absorbance at λmax | Dimensionless | The measured optical absorbance of the sample at the wavelength of maximum absorption, commonly near 280 nm for proteins. |
| ε | Extinction Coefficient | M-1 cm-1 | A substance-specific measure of how strongly the protein absorbs light at the measurement wavelength. |
| b | Pathlength | cm | The optical distance that light travels through the sample, typically 1 cm for a standard cuvette. |
| m | Molecular Mass | g/mol | The molecular mass of the selected protein or amino acid used to convert molar concentration to mass concentration. |
| n | Dilution Factor | Dimensionless | The multiplier that corrects the measured concentration for sample dilution; use 1 for an undiluted sample. |
Unit Conversion Table
Extinction Coefficient Unit Conversion Table
| Unit Group | Unit Name | Symbol | Equivalent in M-1 cm-1 | Used For |
|---|---|---|---|---|
| Popular Units | Inverse Molar Centimeter | M-1 cm-1 | 1 | Standard protein extinction coefficient |
| Scientific Units | Liter per Mole Centimeter | L mol-1 cm-1 | 1 | Equivalent molar absorptivity notation |
| Scientific Units | Inverse Millimolar Centimeter | mM-1 cm-1 | 1000 | Concentrations expressed in millimolar units |
| Scientific Units | Inverse Molar Millimeter | M-1 mm-1 | 10 | Optical paths expressed in millimeters |
Molecular Mass Unit Conversion Table
| Unit Group | Unit Name | Symbol | Equivalent in g/mol | Used For |
|---|---|---|---|---|
| Popular Units | Gram per Mole | g/mol | 1 | Standard molecular mass input |
| Popular Units | Dalton | Da | 1 | Protein and molecular mass reporting |
| Popular Units | Kilodalton | kDa | 1000 | Large protein molecular masses |
| Scientific Units | Kilogram per Mole | kg/mol | 1000 | SI-scale molar mass representation |
| Scientific Units | Milligram per Millimole | mg/mmol | 1 | Equivalent laboratory molar mass notation |
Absorbance Unit Table
| Unit Group | Unit Name | Symbol | Equivalent in Absorbance | Used For |
|---|---|---|---|---|
| Popular Units | Absorbance Unit | AU | 1 AU = 1 | Spectrophotometer absorbance readings |
| Scientific Units | Dimensionless Absorbance | 1 | 1 = 1 AU | Beer-Lambert calculations |
Pathlength Unit Conversion Table
| Unit Group | Unit Name | Symbol | Equivalent in cm | Used For |
|---|---|---|---|---|
| Popular Units | Centimeter | cm | 1 | Standard cuvette pathlength |
| Popular Units | Millimeter | mm | 0.1 | Short-path cuvettes and optical cells |
| Scientific Units | Micrometer | µm | 0.0001 | Microscale optical pathlengths |
| Scientific Units | Meter | m | 100 | SI length conversion |
Dilution Factor Conversion Table
| Unit Group | Unit Name | Symbol | Equivalent in Dilution Factor | Used For |
|---|---|---|---|---|
| Popular Units | Undiluted Sample | 1x | 1 | Stock samples measured without dilution |
| Popular Units | One-to-Two Dilution | 1:2 | 2 | Twofold sample dilution correction |
| Popular Units | One-to-Ten Dilution | 1:10 | 10 | Tenfold sample dilution correction |
| Scientific Units | General Dilution Ratio | 1:n | n | Any valid sample dilution represented by its multiplier |
Protein Concentration Unit Conversion Table
| Unit Group | Unit Name | Symbol | Equivalent in mg/mL | Used For |
|---|---|---|---|---|
| Popular Units | Milligram per Milliliter | mg/mL | 1 | Standard protein concentration reporting |
| Popular Units | Microgram per Milliliter | µg/mL | 0.001 | Lower protein concentrations |
| Popular Units | Microgram per Microliter | µg/µL | 1 | Small-volume laboratory samples |
| Popular Units | Gram per Liter | g/L | 1 | Bulk solution concentration reporting |
| Scientific Units | Milligram per Liter | mg/L | 0.001 | Dilute solution reporting |
| Scientific Units | Nanogram per Microliter | ng/µL | 0.001 | Low-concentration microsamples |
| Scientific Units | Gram per Milliliter | g/mL | 1000 | Highly concentrated mass-per-volume solutions |
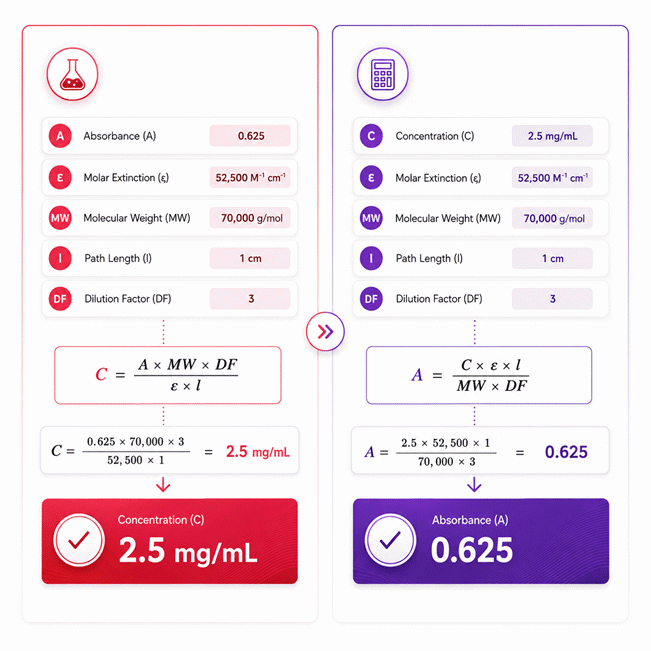
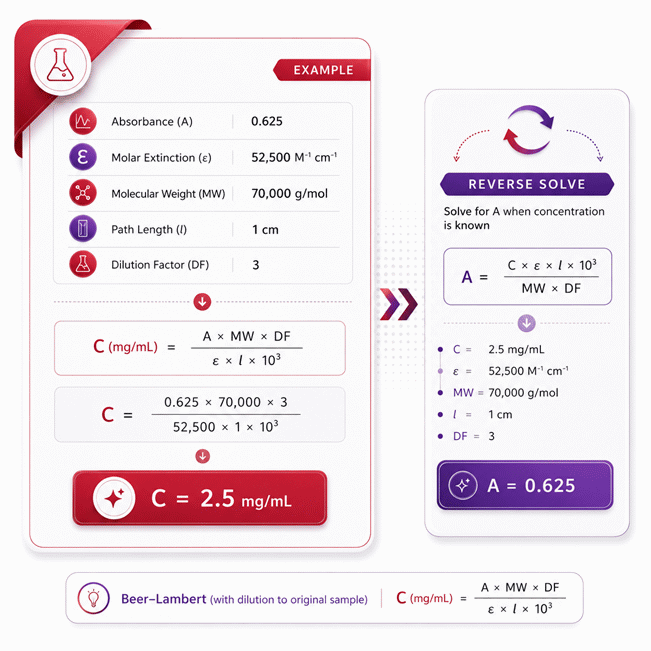
Example Calculation
The molecular mass and optical pathlength are converted to compatible base units before calculation.
The measured absorbance is divided by the extinction coefficient and pathlength relationship.
Molecular mass converts the molar result into mass concentration, while dilution factor corrects the original sample concentration.
The final result is 2.5 g/L, which is numerically equivalent to 2.5 mg/mL.
The target concentration is treated as a known value while absorbance becomes the unknown variable.
The original concentration relationship is rearranged algebraically without changing the calculation method.
The molecular mass is converted from 60 kDa to 60,000 g/mol before solving the equation.
The calculated absorbance of 0.5625 AU satisfies the supplied concentration, pathlength, and dilution conditions.
Results are rounded for display.
Internal calculations use full precision.
Calculations Disclaimer
How Is Protein Concentration Calculated From Absorbance?
A Protein Concentration Calculator becomes useful when an instrument gives an absorbance reading, but not the answer you need. The number on the screen is only the start. A Protein Concentration Calculator connects that optical reading with the properties of your protein and sample. This helps turn raw laboratory data into a practical concentration value.
The key idea is simple. Proteins absorb ultraviolet light at specific wavelengths. Many proteins show useful absorption near 280 nm. This happens mainly because aromatic amino acids absorb ultraviolet light. Tryptophan usually has the strongest effect. Tyrosine also contributes. Cystine can add a smaller contribution.
What Does Absorbance at 280 nm Actually Measure?
A280 does not directly measure protein mass. It measures how much light the sample absorbs near 280 nm. That difference matters. Two proteins can have equal concentrations but different A280 readings. Their amino acid compositions may not be the same.
This is why one universal A280 conversion cannot fit every purified protein. Protein identity matters. Molecular size matters. Light absorption behavior also matters. When these factors match the sample, A280 can give a fast result.
The method is especially useful for purified proteins. It needs no color-forming reagent. It can also preserve precious sample material. This makes it attractive during purification, chromatography, and routine quality checks.
Quick visual path:
UV light enters the sample → protein absorbs part of the light → the instrument measures absorbance → protein properties are applied → concentration is estimated.
When Does A280 Give the Clearest Answer?
A common laboratory problem appears after purification. The sample looks clean, yet its concentration remains uncertain. A280 can solve this quickly when sample purity is high. The buffer should also have low absorbance near the measurement wavelength.
Direct A280 becomes less certain with complex mixtures. Cell lysates contain many absorbing compounds. Nucleic acids may contribute to the spectrum. Some buffers and detergents also absorb ultraviolet light. Turbid samples scatter light instead of only absorbing it.
What Can Quietly Distort the Reading?
One wrong detail can move the result more than expected. A mismatched protein identity can change the interpretation. A poor blank can shift the baseline. A dirty optical surface can also affect the reading. Bubbles may disturb microvolume measurements.
The fastest calculation is not always the best measurement. Good results begin before the number enters the calculator. The sample, instrument, and measurement setup must support the method.
Can You Reverse-Solve a Protein Concentration Calculation?
A common problem appears when concentration is already known. The missing value may be absorbance, dilution, or another parameter. A one-way calculator cannot help much. A reverse-solving workflow can.
Reverse solving uses the same scientific relationship in another direction. It does not introduce a new measurement model. Instead, it treats one known result as an input. The missing quantity becomes the value to calculate.
This is useful during experiment planning. A researcher may know the target concentration before measurement. The expected absorbance can then be estimated. That helps decide whether dilution may be needed before using the instrument.
When Does Reverse Solving Become Useful?
Imagine preparing a concentrated protein stock. You know its expected concentration. You also know its optical properties. The unknown value is the absorbance you should expect. Reverse solving gives a fast consistency check.
Another situation appears during dilution planning. The measured sample may need to remain within the instrument’s useful range. A target concentration can guide the required dilution. This can reduce repeated trial-and-error measurements.
Reverse solving also helps with laboratory troubleshooting. A measured absorbance may disagree with the expected concentration. Solving backward can reveal which input would need to change. That does not prove which input is wrong. It shows where to investigate.
One missing number can expose the whole workflow.
Which Missing Values Can Be Investigated?
A flexible calculator can solve for concentration or another supported variable. The result depends on having enough valid known values. This makes the tool more useful than a fixed input-output form.
The most practical reverse cases involve absorbance, dilution, pathlength, molecular size, or optical response. Some of these values are normally known from instruments or protein records. Others may be checked during method development.
What Makes a Reverse Result Worth Trusting?
Reverse solving cannot repair poor laboratory data. If the original absorbance is distorted, the calculated value inherits that problem. The same applies to an incorrect protein identity. A mathematically valid result can still describe the wrong sample.
Use reverse results as a calculation tool, not as proof of sample quality. When a result looks surprising, verify the experimental inputs first. This small habit prevents large downstream errors.
How Do Sample Quality and Measurement Setup Affect A280 Results?
The most frustrating protein measurement problem is inconsistency. The same sample may produce different readings across instruments or preparations. The cause often lies outside the calculator.
The optical measurement must represent the protein signal as cleanly as possible. Every component in the measurement path can matter. The sample matrix, optical surface, buffer, contamination, and instrument setup all influence the final reading.
Why Does the Blank Matter So Much?
The blank should represent everything except the protein being measured. In most workflows, this means using the same buffer as the sample. If buffer composition differs, background absorption may remain in the result.
This becomes important with ultraviolet-absorbing additives. Some reagents create noticeable background signals. A blank that does not match the sample cannot remove that background correctly.
Fresh preparation can also matter. Buffers may change during storage. Contamination may appear. Temperature differences may affect some measurements. For critical work, the blank and sample should follow the same measurement conditions.
Cuvette or Microvolume Measurement: Why Does the Setup Matter?
A standard cuvette often uses a fixed optical path. Microvolume instruments work differently. They may use very short optical paths. Some systems then report absorbance as a normalized value.
This creates a simple but dangerous mistake. A user may apply another manual path correction after normalization. The value then receives the same correction twice.
Always understand what the instrument reports. The displayed absorbance may represent the physical path. It may also represent an equivalent normalized path. The calculator should receive values that match that interpretation.
Measurement check:
Correct sample → matching blank → clean optical surface → valid absorbance → correct protein data → useful concentration result.
How Do DNA, RNA, Detergents, and Turbidity Change the Picture?
Nucleic acids absorb strongly in the ultraviolet region. Their spectra can overlap with protein measurements. This can make a contaminated protein sample appear more concentrated.
Detergents and other buffer components may also interfere. Their effect depends on chemical composition and wavelength. Some formulations are suitable for direct A280 work. Others make the result difficult to interpret.
Turbidity causes another problem. Suspended particles scatter light. The detector may interpret part of this lost light as absorbance. A cloudy sample can therefore produce misleading results.
When contamination is likely, another protein assay may provide better evidence. The best method depends on sample composition and workflow needs.
What Are the Most Common Protein Concentration Calculation Errors?
A calculation can look perfect and still be wrong. The most expensive mistakes are often simple input mistakes. They are dangerous because the final number still looks reasonable.
The first major error is using protein data from the wrong molecule. Closely related proteins may have different optical behavior. Recombinant changes may also affect the sequence. Tags, truncations, and fusion partners can change molecular properties.
Why Can the Wrong Protein Identity Create a Plausible Wrong Result?
Suppose a protein record describes the untagged sequence. Your laboratory sample contains a large fusion tag. The molecular properties no longer match perfectly. The final concentration may shift even though every entered number looks professional.
This is especially important for custom recombinant proteins. Confirm which molecular form was measured. Monomers, complexes, modified proteins, and fusion constructs should not be mixed without thought.
Antibodies deserve similar care. A generic antibody value may be useful for a quick estimate. It should not automatically replace molecule-specific information when accuracy matters.
Why Can an Instrument Reading Be Correct but the Final Interpretation Be Wrong?
The instrument only reports what it measures. It cannot know whether the sample contains unwanted absorbing compounds. A high reading may reflect protein. It may also include contamination.
Very concentrated samples can create another issue. When absorbance becomes too high, measurement quality may fall. Dilution and remeasurement can often provide a cleaner result.
Very low signals also deserve caution. At low absorbance, small baseline changes become important. The result may look very precise on screen. That does not mean the experiment had the same precision.
A long decimal does not guarantee a good experiment.
How Can You Diagnose a Suspicious Concentration Result?
Start with the sample history. Ask whether it was diluted. Then check the instrument reading. Confirm the protein identity. Review the optical setup. Finally, compare the result with what the purification process suggests.
A tenfold difference often points to dilution handling. A smaller systematic shift may involve path interpretation. Unexpectedly high values can suggest contamination. Unexpectedly low values may reflect weak A280 absorption.
Repeat measurements can help. Independent methods can help even more. Agreement between different techniques gives stronger confidence than one calculation alone.
When Is Direct A280 the Right Choice for Protein Quantification?
The real decision is not whether A280 is popular. The question is whether it fits your sample. Direct A280 works best when speed matters and the protein is reasonably pure.
It is attractive during purification because results appear quickly. No standard curve is required for a protein with reliable optical data. No color reaction must develop. The sample can often remain available after measurement.
When Is A280 a Smart Laboratory Choice?
Purified recombinant proteins are common candidates. Purified antibodies may also work well. Quality control during chromatography can benefit from rapid checks. Concentrated protein stocks are another practical use case.
The method becomes less attractive with complex biological samples. Crude lysates contain proteins, nucleic acids, metabolites, and other components. A single ultraviolet reading cannot separate them.
Protein mixtures also create uncertainty. A mixture does not have one simple molecule-specific optical identity. Direct A280 may still provide an estimate. However, interpretation becomes less specific.
When Should Another Protein Assay Be Considered?
A color-based assay may be better when sample purity is low. It may also help when the protein has weak aromatic absorption. Each assay brings its own limitations, so sample chemistry still matters.
Some assays are sensitive to detergents. Others react differently with different proteins. Standard selection can affect results. This means changing methods does not remove every uncertainty.
The best approach depends on the decision the result will support. A quick purification check needs different confidence than final manufacturing documentation.
How Can You Choose Without Overcomplicating the Workflow?
Start with one question: is the protein sufficiently pure for direct ultraviolet measurement? If yes, A280 can be efficient. If no, consider a method designed for complex samples.
Next, check whether reliable protein-specific optical data exists. If it does, direct calculation becomes stronger. If it does not, treat generic values as estimates.
Then consider sample volume. Microvolume measurement can protect limited samples. Standard cuvettes may offer familiar optical geometry. Choose the setup your laboratory can control reliably.
The best method is the one that matches the sample, not habit.
How Can Protein Concentration Results Support the Next Laboratory Decision?
A concentration value matters only when it guides the next action. After purification, it may determine storage conditions. Before an assay, it may define sample loading. During formulation, it may guide dilution.
This is why concentration work should connect with the wider laboratory workflow. A number should never sit alone. It should answer a practical question.
How Does Concentration Affect Downstream Experimental Planning?
Many protocols require a defined protein mass. Concentration determines the volume needed to reach that mass. An incorrect concentration can therefore affect every later step.
Enzyme assays may depend on accurate loading. Binding studies can require controlled concentrations. Electrophoresis also relies on sensible sample amounts. Small errors can become visible downstream.
Storage planning is another example. Highly concentrated proteins may behave differently during freezing. Some proteins aggregate at high concentration. Others remain stable. Concentration therefore connects measurement with handling.
Why Should Unexpected Results Trigger Investigation Instead of Immediate Acceptance?
Laboratory context is powerful. If a purification step normally yields a modest concentration, a huge unexpected value deserves attention. The calculator may be correct. The input data may not be.
Compare the result with sample volume, purification yield, and previous measurements. Look for dilution history. Check whether the correct protein form was selected. Review any change in buffer composition.
This approach turns calculation into quality control. The goal is not simply obtaining a number. The goal is obtaining a number that makes sense.
What Is the Fastest Reliable Workflow?
Measure the sample carefully. Confirm its identity and measurement conditions. Enter the known values. Review the calculated concentration. Then compare that result with laboratory expectations.
If something looks wrong, use reverse solving to inspect the relationship. Do not force the inputs to match an expected answer. Investigate the experiment instead.
AxiCalculator is designed to support this workflow quickly. The interactive calculation can move in both directions. This makes it useful for measurement, planning, and troubleshooting without adding unnecessary steps.
Frequently Asked Questions
When should I use A280 instead of another protein assay?
How can I tell whether a calculated protein concentration is realistic?
Why should the concentration stay equivalent when I change units?
When is reverse solving useful in a real laboratory workflow?
Which molecular weight and extinction coefficient should I use for a tagged fusion protein?
How should I handle pathlength when my microvolume instrument normalizes A280 automatically?
What should I investigate when A280 and another protein assay disagree significantly?
Engineering Resources
Our engineers are here to help you get it right.