Percent to Goal Calculator
- Last formula update:
Decimal & Rounding Policy
- Calculations use full numerical precision internally to keep percent-to-goal results accurate.
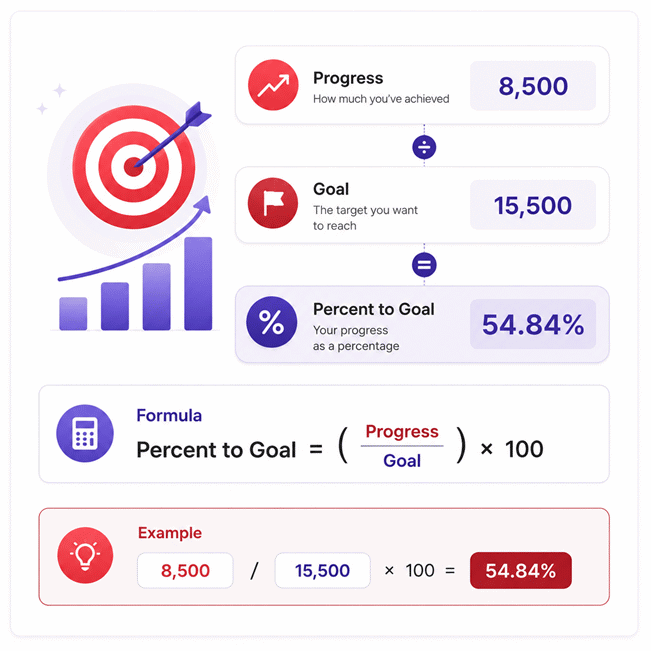
- The percent to goal is calculated as: Percentage = (Progress / Goal) × 100.
- Displayed calculated values are rounded to a maximum of two decimal places when needed.
- Trailing decimal zeros are removed, so 25.00% is displayed as 25%.
- No intermediate values are rounded before the final result is calculated.
- For example, Progress = 15 and Goal = 26 gives approximately 57.69%.
Valid range
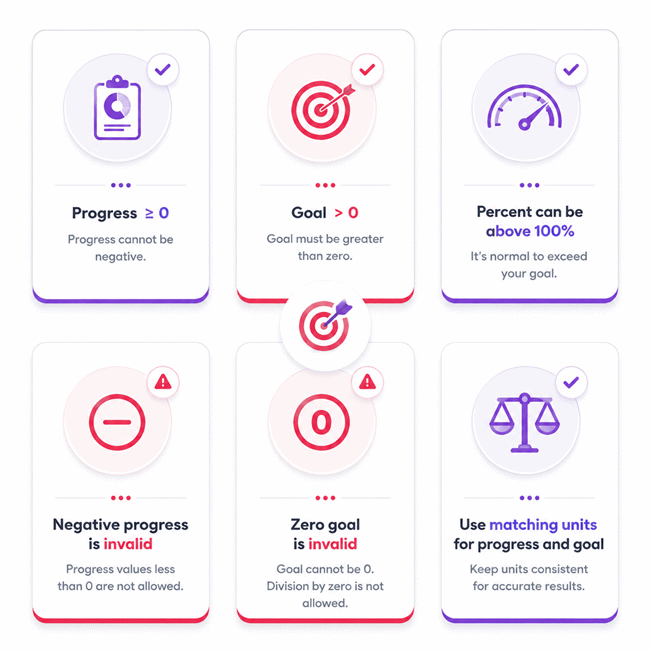
- Progress: Enter a value greater than or equal to 0; negative progress values are invalid.
- Goal: Enter a value greater than 0; zero and negative goal values are invalid.
- Percent to Goal: The percentage may be 0%, above 100%, or negative when produced by a valid reverse calculation.
- The calculation method is locked to: Percent to Goal = (Progress / Goal) × 100.
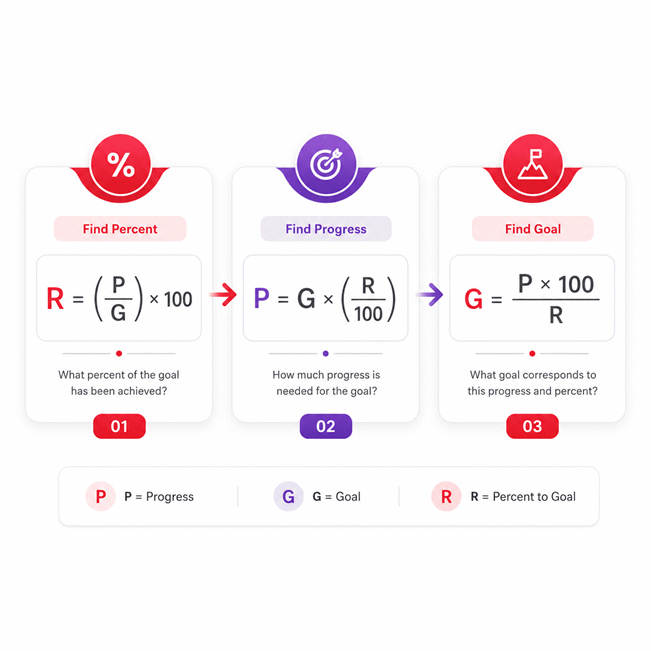
- Reverse calculations use: Progress = Goal × (Percent to Goal / 100) and Goal = (Progress × 100) / Percent to Goal.

Cerelia Daxbourne
Reviewers:
Melovia Pexford
Iskren Lumthorne
Check our editorial policy
August 29, 2026
1.0.0
Initial calculator and formula release.
Our engineers are here to help you get it right.
How Does the Percent to Goal Calculator Show Your Real Progress?
The Percent to Goal Calculator shows how much of a defined target has already been achieved. It compares current Progress with the Goal and converts that relationship into a clear percentage. The result helps you see whether performance is below target, exactly on target, or beyond the planned goal. The calculator also supports reverse solving, so any two known values can determine the missing third value.
- Use Progress and Goal to calculate the percentage already achieved.
- Use Goal and Percent to Goal to determine required Progress.
- Use Progress and Percent to Goal to determine the implied Goal.
- A result below 100% means the target has not yet been reached.
- A result of 100% means Progress exactly matches the Goal.
- A result above 100% means Progress has exceeded the target.
- Choose values from the same reporting period and measurement context.
- Avoid confusing goal attainment with percentage change over time.
The Percent to Goal Calculator is useful for sales targets, project milestones, production goals, fundraising, savings, and other measurable objectives. For reliable decisions, always confirm that the Progress value and Goal describe the same target before interpreting the result.
Assumptions used in this calculator
- Progress and Goal represent the same measurable quantity and unit basis.
- Goal values are assumed to be greater than zero.
- Progress values are assumed to be zero or greater.
- Percent to Goal may validly exceed one hundred percent.
- Input values are assumed accurate and entered without measurement errors.
- Calculations assume Progress and Goal refer to the same reporting period.
- The calculator uses direct mathematical ratios without industry-specific correction factors.
- Intermediate calculations retain full precision before displayed results are rounded.
- Reverse calculations assume the two provided variables are mathematically compatible.
- Results do not account for uncertainty, tolerance, or measurement calibration.
- Industrial users should verify inputs against approved operational records and specifications.
- Results support planning and analysis but do not replace professional judgment.
- Critical decisions should include independent verification under applicable procedures and standards.
Results are rounded for display.
Internal calculations use full precision.
Formulas Used in Percent to Goal Calculator :
Percent to Goal Formula
- R
- Percent to goal, expressed as a percentage.
- P
- Progress, representing the amount already achieved.
- G
- Goal, representing the target amount and required to be greater than zero.
This single relationship defines the complete three-variable calculation. When any two valid values are known, the calculator algebraically rearranges the same relationship to determine the missing value without introducing a separate independent formula. Internal calculations retain full precision, while displayed calculated values may be rounded to a maximum of two decimal places.
Variables & Definitions
View a complete list of all variables used in this calculator, including definitions and units
Percent to Goal Calculator Variables and Valid Input Ranges
| Variable | Symbol | Meaning | Valid Range | Format | Calculation Role |
|---|---|---|---|---|---|
| Progress | P | The amount already achieved toward the goal. | P ≥ 0 | Numeric value on the same quantity basis as Goal | Used with Goal to calculate Percent to Goal, or solved from Goal and Percent to Goal. |
| Goal | G | The target amount that Progress is measured against. | G > 0 | Numeric value on the same quantity basis as Progress | Used as the reference value for percentage calculation, or solved from Progress and Percent to Goal. |
| Percent to Goal | R | The percentage of the Goal represented by the current Progress. | Any finite percentage; values above 100% are allowed | Percentage (%) | Calculated from Progress and Goal, or used with either value for reverse calculation. |
Unit Conversion Table
Percent to Goal Percentage Conversion Table
| Unit Group | Unit Name | Symbol | Equivalent in Decimal Ratio | Used For |
|---|---|---|---|---|
| Dimensionless Ratio | Percent | % | 1% = 0.01 | Displaying Percent to Goal from Progress divided by Goal. |
| Dimensionless Ratio | Percent | % | 25% = 0.25 | Converting Percent to Goal for reverse Progress or Goal calculations. |
| Dimensionless Ratio | Percent | % | 100% = 1 | Representing Progress equal to the Goal. |
| Dimensionless Ratio | Percent | % | 125% = 1.25 | Representing Progress that exceeds the Goal. |
Percent to Goal Decimal Ratio Conversion Table
| Unit Group | Unit Name | Symbol | Equivalent in Percent | Used For |
|---|---|---|---|---|
| Dimensionless Ratio | Decimal Ratio | 1 | 0.01 = 1% | Internal ratio representation before percentage scaling. |
| Dimensionless Ratio | Decimal Ratio | 1 | 0.25 = 25% | Using Percent to Goal as a multiplier in reverse calculations. |
| Dimensionless Ratio | Decimal Ratio | 1 | 1 = 100% | Representing complete achievement of the Goal. |
| Dimensionless Ratio | Decimal Ratio | 1 | 1.25 = 125% | Representing Progress greater than the Goal. |
Example Calculation
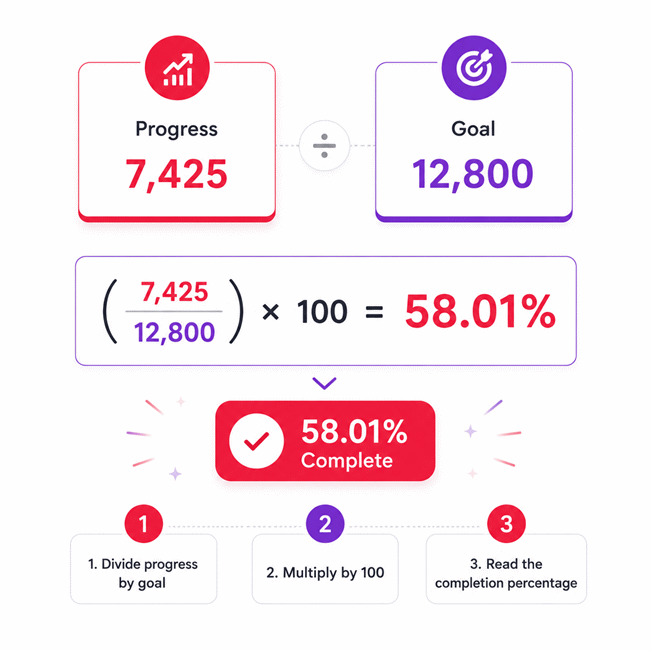
A progress value of 7,425 toward a goal of 12,800 represents 58.01% completion.
The calculation divides Progress by Goal and converts the resulting ratio to a percentage.
Full precision is retained during calculation before the displayed result is rounded.
A result below 100% indicates that part of the target still remains to be achieved.
A goal of 18,750 at 64% completion corresponds to a Progress value of 12,000.
Reverse solving converts the percentage to its decimal ratio before multiplying by Goal.
The known Goal and Percent to Goal values determine the missing Progress automatically.
The calculated Progress remains on the same quantity basis as the Goal value.
Results are rounded for display.
Internal calculations use full precision.
Calculations Disclaimer
How Does a Percent to Goal Calculator Turn Progress Into a Clear Decision?
A Percent to Goal Calculator solves a common reporting problem. Raw progress numbers often lack context. The Percent to Goal Calculator compares current progress with a defined target. It then expresses that relationship as an easy percentage. That single number makes progress easier to read. It also supports faster decisions in work and personal planning.
A sales figure of 8,000 means little without its target. The same applies to savings or production output. A percentage adds the missing context. It shows whether performance is far behind, near target, or beyond target. This makes the metric useful across many fields.
AxiCalculator also supports reverse solving. You are not limited to one calculation direction. Two known values can determine the missing third value. This is useful when planning future goals. It also helps when checking a report backward.
The biggest benefit is clarity. Users can move between Progress, Goal, and Percent to Goal. They do not need separate tools for each direction. This keeps the workflow fast and consistent.
Why Does Goal Progress Need More Context Than a Raw Number?
A progress figure can look impressive while still missing the target. This creates a common decision problem. Large numbers often attract attention before their context is checked. A goal percentage solves that problem quickly.
Suppose a team reports strong monthly output. The number may sound successful. Yet the planned target could be much higher. The percentage reveals the real position immediately. This reduces guesswork during reviews.
The same logic applies to personal goals. Savings, fundraising, study plans, and production targets all need context. Progress becomes meaningful only when compared with the intended destination.
This is why goal completion percentage works well as a summary metric. It converts two related numbers into one clear performance signal. Managers can compare departments more easily. Individuals can also understand progress without reading a full report.
Why Is Reverse Solving Useful When the Missing Value Is Not the Percentage?
A percentage is not always the unknown value. Sometimes the target is missing. In other cases, the achieved amount must be found. A fixed one-way calculator cannot solve these situations efficiently.
Reverse solving removes that limitation. Enter the two values you already know. The remaining field can then be determined automatically. This makes the calculator useful for both reporting and planning.
A manager may know the target and desired completion rate. The missing value is required performance. A planner may know current progress and completion rate. The missing value is the implied goal. Both tasks use the same relationship.
This flexibility also helps with verification. A reported percentage can be checked backward. If the reconstructed value differs from the original report, the inputs deserve another review.
What Makes Goal Completion Percentage Useful for Real Decisions?
A percentage becomes valuable when it changes a decision. Simply displaying a number is not enough. The result should help users decide what to do next.
Goal completion percentage answers a direct question. How much of the target has already been achieved? That answer supports planning, reporting, and performance reviews. It also makes progress easier to compare across different targets.
A small team and a large team may have different goals. Their raw results cannot be compared fairly. Their completion percentages can provide a clearer view. Each result is measured against its own target.
This metric also helps identify overachievement. A result above the target is not automatically an error. It can show that actual progress exceeded the planned goal. That information can affect staffing, forecasting, and future targets.
How Should Current Progress Be Chosen Before You Calculate?
The wrong Progress value can make a correct calculation misleading. Progress should represent the amount already achieved toward the chosen goal. It should come from the same reporting context.
For sales, use the sales amount already completed. For fundraising, use funds already raised. For production, use actual completed output. Avoid mixing projected values with completed values unless your reporting method requires it.
Timing also matters. A monthly target should normally use monthly progress. Combining weekly progress with an annual goal can produce a mathematically valid result. The business meaning may still be poor.
The safest approach is simple. Decide what the goal measures first. Then select the matching achieved amount. This prevents many reporting errors before calculation begins.
How Should the Target Be Defined Before Performance Is Measured?
A moving target can make performance reports confusing. The Goal should represent the target used for the same evaluation period. It should also match the purpose of the report.
A sales team may have monthly, quarterly, and annual targets. Using the wrong target changes the meaning completely. The number might still look reasonable. That makes the mistake harder to notice.
A clear goal also supports better comparisons. Users can compare current progress against the same approved target. Changes to that target should be documented in operational workflows.
When targets change during a period, avoid silently mixing versions. Select the goal that belongs to the report. This keeps the resulting percentage understandable and defensible.
What Changes When a Target Is Revised During the Reporting Period?
A revised target can change performance without changing actual progress. This often surprises users. The achieved amount may remain identical. Yet its percentage of the new target can move immediately.
This does not mean the calculation failed. The reference point changed. That distinction matters in sales reviews and project reporting. A target revision should therefore be treated as a reporting event.
Teams should avoid comparing percentages created from different target versions without context. Otherwise performance can appear to improve or decline artificially.
For clean reporting, keep each calculation tied to one target version. When a goal changes, record the change separately. This preserves the meaning of earlier percentages.
How Should You Use the Calculator Without Creating a Misleading Result?
The fastest calculation is not always the safest calculation. Users often enter two numbers without checking their meaning first. That can produce a precise but useless result.
Start by identifying the real question. Are you measuring achievement? Are you planning required progress? Are you reconstructing a missing target? The answer determines which two values should be treated as known.
Next, check that both values belong to the same situation. A project target should match project progress. A sales quota should match sales performance. A savings target should match actual savings.
Then use the live result as a decision aid. Do not focus only on the displayed percentage. Ask what the result means for the next action. That is where the calculator becomes useful.
Why Should You Start With the Decision Instead of the Numbers?
A common mistake starts before any number is entered. Users focus on available data instead of the decision they need to make. This can lead to the wrong calculation direction.
If you need an achievement percentage, Progress and Goal are your known values. If you need required performance, Goal and desired percentage become more useful. If you need the implied target, Progress and percentage become the starting point.
This decision-first method reduces unnecessary trial and error. It also makes reverse solving easier to understand. The calculator becomes a small planning system instead of a simple percentage tool.
Ask one question before typing: what value must I know next? That question usually reveals the correct input pair.
Progress → Compare with Goal → Percent to Goal → Decision
How Should You Read the Result Without Overreacting to One Percentage?
A percentage can feel more certain than the data behind it. This creates a subtle reporting risk. A clean number may hide an incomplete target or outdated progress value.
Read the result together with its context. Check the reporting period. Check the target definition. Check whether the progress value is final or still changing.
A high result can show strong performance. It can also reflect a target that was set too low. A low result can signal poor progress. It may also reflect a new or unusually ambitious target.
The percentage should guide questions, not end them. Good decisions use both the metric and the conditions behind it.
Why Do Three Editable Fields Make the Workflow Faster?
One-way calculators force users into a fixed workflow. That becomes frustrating when the missing value changes. Three editable fields remove that restriction.
AxiCalculator treats Progress, Goal, and Percent to Goal as connected values. The user can work from any useful pair. The third value is updated from that relationship.
This is especially useful during planning meetings. One moment may require a completion rate. The next may require a target. A third question may ask for required progress.
Keeping everything in one workspace reduces switching. It also lowers the chance of using different methods across related calculations.
How Does Reverse Solving Improve Planning and Forecasting?
Reporting tells you where you are. Planning asks where you need to go. Reverse solving connects those two tasks.
A forward result measures achievement against a goal. Reverse solving starts from a desired outcome. It then reveals the missing target or required progress value.
This can support sales planning, fundraising, production scheduling, and personal targets. A desired completion percentage can become a concrete amount. A current amount can reveal the target implied by a reported percentage.
The method also makes performance discussions more practical. Instead of saying “we need better results,” teams can identify the value linked to a specific target level.
How Can a Known Goal and Percentage Reveal Required Progress?
A target alone does not tell a team what current performance should be. A desired completion level adds the missing benchmark. Together, they can reveal the progress amount linked to that level.
This is useful during checkpoints. A manager may want to know the progress required for a certain stage. A project lead may need a milestone amount. A fundraiser may want a target for the next campaign review.
The result turns an abstract percentage into a concrete value. That often makes planning easier. People usually act more confidently on an amount than on a percentage alone.
This reverse direction is also useful for scenario planning. Different completion levels can be tested quickly without changing the goal.
How Can Known Progress and Percentage Reveal the Implied Goal?
Sometimes a report contains progress and a completion percentage but no target. This creates an audit problem. The missing goal can still be reconstructed from the available relationship.
That makes reverse solving useful during report checks. It can reveal the target that must have been used. The reconstructed value can then be compared with the approved target.
If the values do not match, the report may use a different target. It may also contain a data entry error. Either situation deserves investigation.
This ability is valuable because percentages often travel without their original context. Reverse solving can help restore that missing context.
What Happens When You Edit a Value That Was Calculated Automatically?
A calculated field can become the next input. This is useful during live planning. The user may see a result and immediately want to test a different outcome.
AxiCalculator supports that workflow. Editing a calculated value changes the active relationship. The system can then solve the value that is no longer treated as fixed.
This prevents users from clearing the entire calculator after every change. It also mirrors real decision making. People often refine targets by adjusting a result they just saw.
The interaction feels simple, but the benefit is significant. One calculator can support several connected questions without changing modes.
Known Goal + Desired Percent → Required Progress
Known Progress + Desired Percent → Implied Goal
Known Progress + Goal → Achievement Percentage
How Should Percent to Goal Results Be Interpreted in Practice?
A result is useful only when its meaning is clear. Many users instinctively treat 100% as the maximum. That can create confusion when performance exceeds the target.
Percent to goal measures achievement relative to a target. A result below the target means some achievement remains. Reaching 100% means progress matches the defined goal. Moving above 100% means progress exceeded that goal.
This interpretation works well for many target-based systems. It can describe quota achievement, production targets, fundraising, savings, and other measurable goals.
The number does not explain why performance changed. It only shows the relationship between current progress and the target. Analysis should come after that measurement.
What Do Results Below, At, and Above 100% Tell You?
A single percentage can describe three very different states. Understanding those states prevents incorrect conclusions.
A result below 100% means the target has not been fully reached. The closer the result moves toward 100%, the closer progress is to the target.
A result at 100% means current progress matches the goal. It does not automatically mean the work should stop. Some targets are minimum thresholds rather than hard limits.
A result above 100% means progress surpassed the defined target. That can indicate strong performance. It can also suggest that future targets need review.
The percentage therefore acts as a status signal. The business meaning depends on the goal itself.
Why Does Percent to Goal Not Automatically Tell You Whether Progress Is On Schedule?
A common planning mistake confuses completion with timing. Percent to goal measures achievement against a target. It does not measure time consumed.
A project can be 60% complete and still be late. It can also be 60% complete and ahead of schedule. The answer depends on elapsed time and the project plan.
The same issue appears in sales. Reaching 70% of an annual target means little without the date. Seventy percent in March differs greatly from seventy percent in December.
Use percent to goal as an achievement metric. Use time-based progress separately when schedule performance matters.
How Can Percentages Make Different Goal Sizes Easier to Compare?
Raw values can hide relative performance. A team with larger sales may still be farther from its target. Percentage attainment provides another perspective.
Each result is measured against its own goal. This makes percentages useful when targets differ in size. A smaller department can therefore be compared more fairly with a larger department.
However, the targets themselves should still be reasonable. Percentages cannot fix poorly designed goals. An easy target may produce a high percentage without exceptional performance.
Use percentage comparison as one layer of analysis. Keep target quality and business context visible beside it.
Which Common Mistakes Make Goal Progress Reports Look Better or Worse Than Reality?
The most dangerous mistakes often produce believable numbers. That makes them harder to catch. A calculator can process the inputs correctly while the inputs describe the wrong situation.
Typical problems include using the wrong target, mixing reporting periods, or selecting incomplete progress data. Users may also compare percentages from targets built under different rules.
Another mistake involves changing the goal after performance is measured. The new percentage may look better or worse even though progress never changed.
The safest workflow includes a quick context check before every important calculation. Confirm what the progress value represents. Confirm which target applies. Then interpret the result.
Why Is Choosing the Wrong Baseline One of the Most Serious Errors?
The baseline determines what the percentage means. If the wrong target is selected, every later interpretation becomes unreliable.
This often happens when several targets exist. A sales representative may have monthly and quarterly quotas. A project may have original and revised targets. A campaign may have minimum and stretch goals.
The calculator cannot decide which target belongs to the report. That decision must come from the user or reporting process.
Before calculating, identify the target version clearly. This small check prevents large reporting mistakes. It also makes future comparisons much easier.
Why Can Mixing Reporting Periods Create a Misleading Completion Percentage?
Time periods can quietly distort an otherwise simple calculation. A weekly progress value should not be compared casually with a yearly target.
The numbers may still create a percentage. The percentage may even look reasonable. Yet it does not represent the intended performance period.
This problem often appears in dashboards with automated imports. Progress may update daily while the selected target belongs elsewhere. A clear period label can prevent that confusion.
For dependable reporting, Progress and Goal should belong to the same evaluation window. This keeps the result meaningful for both users and managers.
Why Is Goal Attainment Different From Percentage Change?
Two percentage metrics can answer completely different questions. Confusing them can lead to poor decisions.
Goal attainment asks how current progress compares with a target. Percentage change asks how a value changed from an earlier value. Their reference points are different.
A business may improve strongly compared with last year. It can still miss its current target. The opposite can also happen. A team can reach its target while showing little growth.
Choose the metric that matches the decision. Use goal attainment for target performance. Use percentage change for growth or decline over time.
Where Does Percent to Goal Fit Into Real-World Workflows?
Many teams already track targets but still struggle with interpretation. Raw values appear in spreadsheets, dashboards, and reports. The missing layer is often a fast progress signal.
Percent to goal can provide that layer. It can summarize target performance before a meeting. It can support a checkpoint during a project. It can also help individuals track personal targets.
The calculation works best when the underlying data remains well defined. Users should know what counts as Progress. They should also know which Goal controls the report.
AxiCalculator reduces the calculation effort. The user can focus on the decision instead. That is especially useful when several scenarios must be reviewed quickly.
How Can Sales, Projects, Savings, and Other Targets Use the Same Goal Metric?
Different activities can share the same target logic. Sales teams compare achieved revenue with quota. Project teams compare completed output with planned output. Savers compare accumulated funds with a financial target.
Fundraising campaigns can also track raised funds against a campaign goal. Production teams can compare completed units with planned output. Training programs can track completed requirements against a defined target.
The calculation structure stays consistent across these uses. The meaning comes from the chosen Progress and Goal values.
This makes the metric flexible without making it vague. Define the target clearly. Track the matching progress. Then use the percentage as a quick status signal.
Frequently Asked Questions
Should I use actual progress or forecasted progress in the calculator?
Can I report Percent to Goal without showing the underlying Progress and Goal?
Can I keep one value fixed while testing several goal scenarios?
Is a very high Percent to Goal always evidence of excellent performance?
How can I audit a reverse-solved Goal against an engineering or KPI report?
How should sensor-derived Progress data be handled before calculating target attainment?
Can I average Percent to Goal values across several production lines or departments?
Engineering Resources
Our engineers are here to help you get it right.