Percentage Point Calculator
- Last formula update:
Decimal & Rounding Policy
- Calculations use full internal precision to minimize rounding errors.
- Results are rounded only for display, typically to about four significant digits.
- Intermediate values are never rounded before the final result is calculated.
- Both decimal points and decimal commas are accepted in numeric inputs.
- Percentage points and percentage differences may include positive, negative, zero, or decimal values.
Valid range
- Percent #1 (P1): Must be greater than 0; values above 100% are allowed and serve as the reference percentage.
- Percent #2 (P2): Must be greater than 0; values above 100% are allowed and are compared directly with P1.
- Percentage Point Difference (DPP): May be positive, zero, or negative and is calculated as P2 – P1.
- Percentage Difference (DPCT): May be positive, zero, or negative and is calculated as (DPP / P1) × 100.
- Total Value (T): May be positive or negative but cannot equal 0 when used in percentage-to-value calculations.
- Value #1 (V1): May be positive, zero, or negative and follows V1 = T × P1 / 100.
- Value #2 (V2): May be positive, zero, or negative and follows V2 = T × P2 / 100.
- Value Difference (DV): May be positive, zero, or negative and is calculated as V2 – V1.

Cerelia Daxbourne
Reviewers:
Melovia Pexford
Iskren Lumthorne
Check our editorial policy
August 29, 2026
1.0.0
Initial calculator and formula release.
Our engineers are here to help you get it right.
How Does a Percentage Point Calculator Help You Compare Percentage Changes?
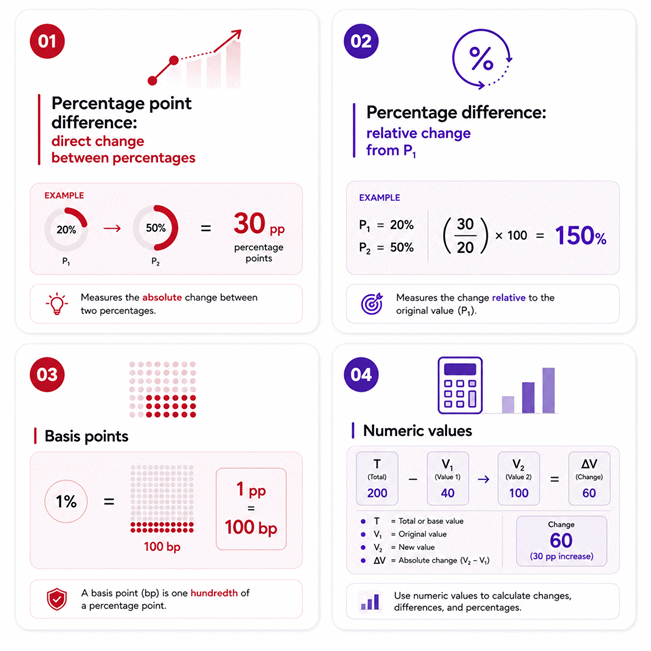
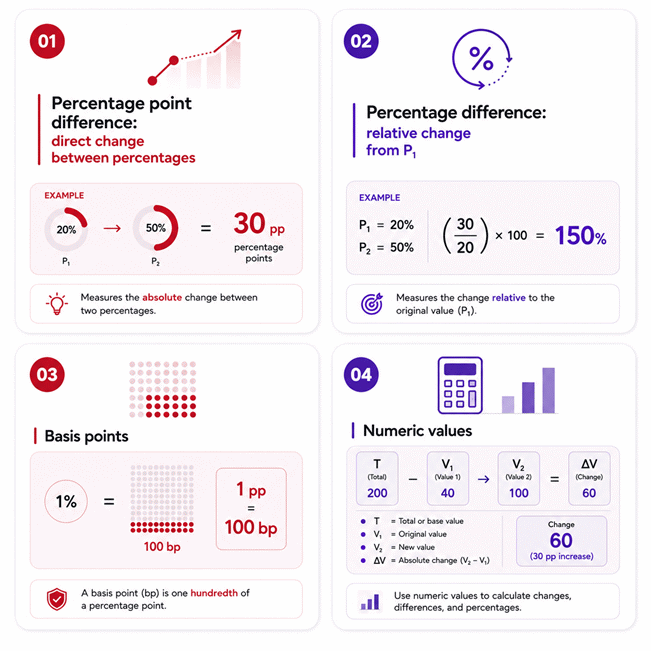
Percentage Point Calculator helps you measure the direct change between two percentage rates without confusing percentage points with relative percent change. It also supports reverse solving when a related starting value, ending value, or numeric amount is missing.
- Percentage points show the direct signed gap between two percentages.
- A positive point change means the second percentage is higher.
- A negative point change means the second percentage is lower.
- Relative percentage change measures movement against the first percentage as the baseline.
- The same point change can produce very different relative changes.
- Reverse solving can recover supported missing percentage or numeric values.
- Total value connects percentage rates with their corresponding numeric amounts.
- Value difference shows the signed change between two related numeric values.
- Percentage points are useful for margins, conversion rates, retention, statistics, and market share.
- Basis points provide another practical way to describe small rate movements.
- Clear labels prevent percentage-point changes from being mistaken for percent increases.
The Percentage Point Calculator is most useful when you need a fast comparison, a clear interpretation, or a supported reverse calculation from incomplete data. Always interpret the result within the meaning and context of the percentages being compared.
Assumptions used in this calculator
- Percent #1 is treated as the baseline for relative percentage change.
- Percent #2 is compared directly with the baseline percentage.
- Percentage point difference uses signed subtraction, not absolute difference.
- Percentage difference is measured relative to Percent #1.
- Percent #1 and Percent #2 must remain greater than zero.
- Percentage values above 100 are permitted when mathematically valid.
- Total value must be nonzero when used in reverse calculations.
- Value #1, Value #2, and value difference may be negative.
- Calculations use full precision before final display rounding.
- Displayed rounding does not alter the underlying calculated result.
- Only supported variable relationships trigger automatic reverse calculations.
- Physical quantities must use consistent units when values represent measurements.
- Measurement uncertainty and source-data errors are not automatically modeled.
Results are rounded for display.
Internal calculations use full precision.
Formulas Used in Percentage Point Calculator :
Percentage Point Calculator Formulas
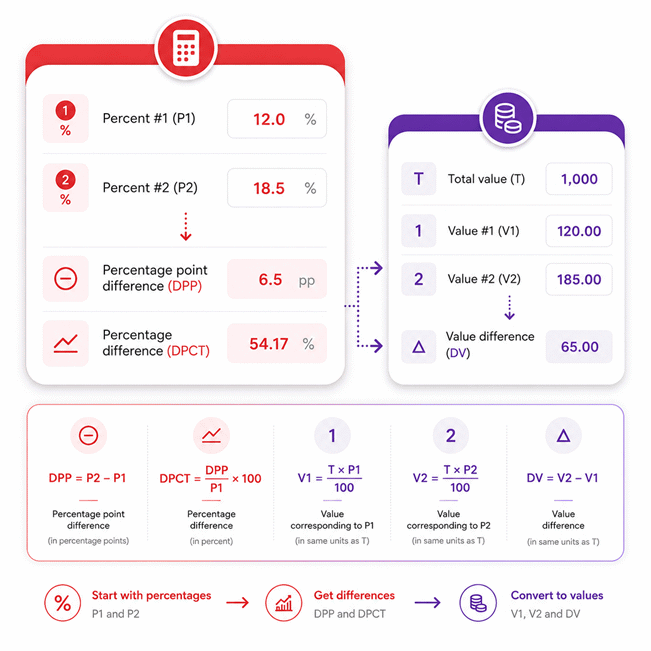
The calculator uses the following independent equations for percentage points, relative percentage change, and their corresponding numeric values. These equations also provide the mathematical relationships required for supported reverse calculations.
1. Percentage Point Difference
2. Percentage Difference
3. Value #1
4. Value #2
5. Value Difference
Variable Definitions
- P1 — first or reference percentage.
- P2 — second or comparison percentage.
- DPP — signed percentage point difference, measured in percentage points.
- DPCT — signed relative percentage difference, measured in percent.
- T — total numeric value used to convert percentages into values.
- V1 — numeric value corresponding to the first percentage.
- V2 — numeric value corresponding to the second percentage.
- DV — signed difference between the two numeric values.
Calculations use full internal precision and are rounded only for display. Positive differences indicate an increase, negative differences indicate a decrease, and zero indicates no change. Reverse solving uses the same mathematical relationships only when the calculator's supported input combination provides enough information.
Variables & Definitions
View a complete list of all variables used in this calculator, including definitions and units
Percentage Point Calculator Variables and Definitions
| Variable | Parameter | Definition | Unit | Valid Range |
|---|---|---|---|---|
| P1 | Percent #1 | The first or reference percentage used as the baseline for comparison. | % | Greater than 0; values above 100 are allowed. |
| P2 | Percent #2 | The second percentage compared directly with the reference percentage. | % | Greater than 0; values above 100 are allowed. |
| DPP | Percentage Point Difference | The signed arithmetic difference between the second and first percentages. | pp | Positive, zero, or negative. |
| DPCT | Percentage Difference | The signed relative percentage change measured against the first percentage. | % | Positive, zero, or negative. |
| T | Total Value | The total numeric amount used to convert percentages into corresponding values. | Unitless | Any finite nonzero value. |
| V1 | Value #1 | The numeric value corresponding to the first percentage of the total value. | Unitless | Positive, zero, or negative. |
| V2 | Value #2 | The numeric value corresponding to the second percentage of the total value. | Unitless | Positive, zero, or negative. |
| DV | Value Difference | The signed arithmetic difference between Value #2 and Value #1. | Unitless | Positive, zero, or negative. |
Unit Conversion Table
Percentage Unit Conversion Table
| Unit Group | Unit Name | Symbol | Equivalent in Decimal | Used For |
|---|---|---|---|---|
| Percentage | Percent | % | 1% = 0.01 | Percent #1, Percent #2, and Percentage Difference |
| Percentage | Decimal Proportion | Decimal | 1.00 = 100% | Internal interpretation of percentage values |
Percentage Point Conversion Table
| Unit Group | Unit Name | Symbol | Equivalent in Basis Points | Used For |
|---|---|---|---|---|
| Percentage Point | Percentage Point | pp | 1 pp = 100 basis points | Percentage Point Difference |
| Percentage Point | Basis Point | bp | 1 bp = 0.01 pp | Expressing small percentage-point changes |
Unitless Numeric Value Table
| Unit Group | Unit Name | Symbol | Equivalent in Base Unit | Used For |
|---|---|---|---|---|
| Numeric Value | Total Value | T | 1 unit = 1 base unit | Total quantity used for percentage-to-value calculations |
| Numeric Value | Value #1 | V1 | Uses the same base unit as T | Numeric amount corresponding to Percent #1 |
| Numeric Value | Value #2 | V2 | Uses the same base unit as T | Numeric amount corresponding to Percent #2 |
| Numeric Value | Value Difference | DV | Uses the same base unit as T | Signed difference between Value #2 and Value #1 |
Example Calculation
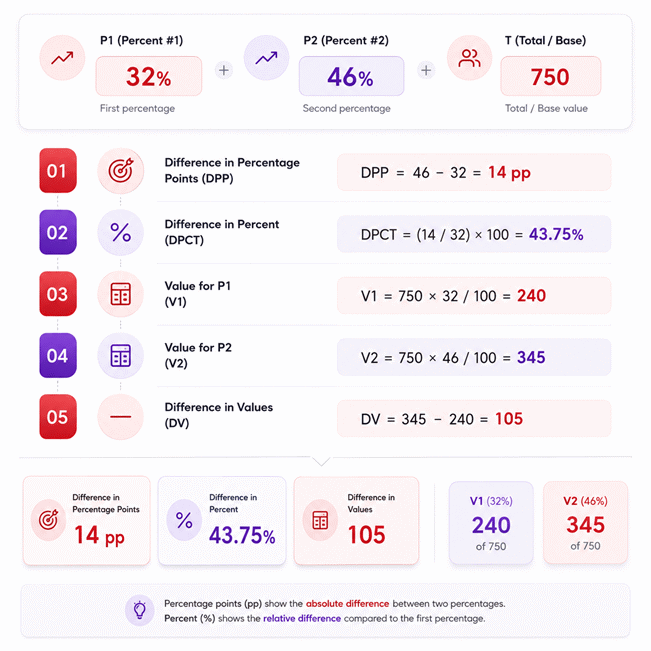
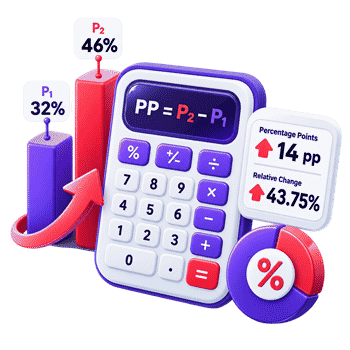
The percentage rises from 32% to 46%, which is an increase of 14 percentage points. Relative to the original 32%, this represents a 43.75% increase. For a total value of 750, the corresponding values are 240 and 345. Their numeric difference is therefore 105.
This reverse calculation starts with Percent #2 and the known percentage point difference to recover Percent #1. The recovered baseline then determines the signed relative percentage change. Adding the total value allows both corresponding numeric values to be calculated. Their difference is then obtained from the supported numeric relationship.
Results are rounded for display.
Internal calculations use full precision.
Calculations Disclaimer
What Is a Percentage Point and Why Does It Matter?
A Percentage Point Calculator answers a simple question with serious consequences. A Percentage Point Calculator shows the direct gap between two percentages. This gap is easy to misread in reports. That mistake can change a business decision. It can also distort a performance review.
Suppose a dashboard shows two different rates. One rate belongs to an earlier period. The other belongs to the current period. A reader may call the change a percent increase. That wording may be wrong. Percentage points describe the direct movement between those rates. Relative change answers another question.
Percentage Points vs Percent: The Difference That Changes Your Answer
Percent and percentage points are not interchangeable terms. A percent often describes a share of a whole. A percentage point describes movement between two percentages. This distinction matters in finance, sales, marketing, statistics, and public reporting.
A small wording error can make a change appear much larger. It can also make real growth appear smaller. Clear language removes that risk. Use percentage points when discussing the direct gap between percentage rates. Use relative change when comparing growth against the starting rate.
Quick check: first ask whether you need a gap or a relative change.
Percentage Points vs Percentage Change: Absolute Gap or Relative Change?
Two percentages can produce two correct change measures. Those measures answer different questions. Percentage point change asks how far one percentage moved. Relative percentage change asks how large that movement was against the baseline.
This creates an important reporting rule. Never present one measure as a substitute for the other. A manager may need the direct movement. An analyst may also need relative performance. Showing both can prevent a costly misunderstanding.
This is especially useful with conversion rates and market shares. It also helps when comparing margins or response rates. Direct movement is often easier to scan. Relative change can show the scale of improvement.
What Does “pp” Mean When Comparing Percentages?
The abbreviation “pp” means percentage points. It identifies a direct difference between percentage values. This small label prevents a large communication error. It tells the reader exactly how the result should be interpreted.
Use “pp” when the direction also matters. A positive result shows an increase. A negative result shows a decrease. A zero result means the percentages are equal.
How to Calculate Percentage Point Difference Without Misreading the Result
A common problem starts when two percentages appear beside each other. The reader immediately asks, “How much did this change?” That question still has two possible meanings. The safest first step is identifying the desired comparison.
For a percentage point comparison, focus on direct movement. The starting percentage acts as the first reference. The second percentage represents the new position. Their signed gap tells you the direction and size.
How to Read a Percentage Point Increase Correctly
An increase occurs when the second percentage exceeds the first. The result should remain a percentage-point result. It should not be silently renamed as relative growth.
This matters in performance dashboards. A conversion rate can improve without doubling. A profit margin can rise without increasing by the same relative percentage. The percentage-point view keeps the reporting direct.
The same approach works with approval rates and defect rates. It also works with occupancy rates and retention rates. The context changes, but the comparison remains consistent.
Starting rate → direct movement → new rate → percentage-point interpretation
Starting rate → relative comparison → proportional change → percentage interpretation
How to Read a Percentage Point Decrease Without Losing the Direction
A decrease should remain negative when direction matters. Removing that sign removes useful information. It can make a decline look like an unsigned distance.
This becomes critical with failure rates and cancellation rates. A negative movement may actually represent an improvement. The meaning depends on what the percentage measures.
A falling defect rate is usually favorable. A falling retention rate is usually unfavorable. The calculator gives the mathematical direction. The user must interpret the business meaning.
How Negative and Zero Percentage Point Changes Should Be Interpreted
A negative result means the second percentage is lower. Zero means both percentages are equal. Neither result is automatically good or bad.
Context always controls the practical meaning. This simple rule prevents emotional interpretation from replacing accurate analysis.
Do not judge the sign before checking what the percentage actually measures.
How to Understand Relative Percentage Difference Correctly
A direct gap may not reveal the full size of a change. This becomes obvious when the starting percentage is small. A modest point movement can represent major relative growth.
The key idea is the baseline. Relative change compares movement against the first percentage. Therefore, the same point movement can produce different relative results.
Why Percent #1 Acts as the Baseline for Relative Change
The first percentage provides the reference point. Without that reference, relative change loses its meaning. This explains why baseline selection matters so much.
Consider two departments with identical point improvements. One began with a low success rate. The other began with a high success rate. Their point movement may match. Their relative improvement can still differ greatly.
This is why good reporting names the baseline clearly. Avoid hiding it in a chart legend. Place it near the comparison when possible.
The baseline also prevents misleading claims. A large relative increase may come from a tiny starting value. A small relative increase may still represent meaningful absolute movement.
How Percentage Points and Relative Change Can Tell Different Stories
The two measures are not competitors. They provide different views of the same movement. Percentage points describe distance. Relative change describes scale against the starting point.
A decision maker may need both views. The direct gap is useful for quick comparison. Relative change is useful for understanding proportional improvement.
This difference becomes important in marketing analytics. It also matters in financial reporting. Health metrics and operational dashboards face the same issue.
When the Direct Percentage-Point Gap Is More Useful
Use the direct gap when stakeholders already understand both percentages. It is also useful when comparing rates across periods. The result stays close to the original data.
This approach reduces mental work. Readers see the movement without converting the result. That speed can improve decision quality during fast reviews.
One change can have two valid stories. Choose the story your decision needs.
How Reverse Solving Works in the Percentage Point Calculator
Real work rarely gives every value in perfect order. Sometimes the starting percentage is missing. Sometimes the ending percentage is unknown. A useful calculator should handle supported missing-value situations.
Reverse solving changes the direction of the calculation. A known result can become an active input. The calculator then solves another related value.
This makes the tool more useful during audits and planning. It also helps when reviewing incomplete reports. You do not need to rebuild the entire calculation manually.
How to Find Percent #2 From Percent #1 and Percentage Point Difference
Imagine a report gives the original rate and its point movement. The final percentage may be missing. Reverse solving can recover that missing percentage.
The signed direction remains important. A positive point movement raises the final rate. A negative movement lowers it. That distinction must remain intact during reverse solving.
This is especially useful for forecast reviews. It can also help with target planning. A team may know its current rate and desired improvement. The missing target rate can then be recovered.
How to Find Percent #1 From Percent #2 and Percentage Point Difference
The reverse situation also appears often. A report may provide the current rate. It may also show the known point movement. The earlier percentage may be missing.
Reverse solving can recover the original reference. This helps users reconstruct a historical comparison. It also supports data checks when source tables are incomplete.
The latest meaningful input should remain important. Otherwise, editing a calculated field would feel unpredictable. A well-designed calculator should respect recent user intent.
Why Some Input Combinations Intentionally Do Not Trigger Reverse Calculations
More algebra does not always create a better interface. Some value combinations may be mathematically rearranged. That does not mean every combination should trigger automatically.
This calculator follows defined solving relationships. Unsupported pairs remain unresolved until enough relevant information exists. This behavior reduces surprising outputs.
Why Editing a Calculated Result Can Change an Earlier Input
A calculated result can later become a new manual input. This creates a useful shift in priority. The newer value becomes part of the active problem.
An older related value may then be recalculated. This keeps reverse solving interactive instead of rigid.
How Percentage Points Connect to Total and Numeric Values
A percentage alone may not answer a practical business question. Teams often need the actual numeric amount behind that percentage. This is where total and partial values become useful.
A rate can represent orders, users, defects, responses, or transactions. Connecting percentage data with numeric values makes the result easier to use.
How to Connect Percent #1 and Percent #2 With Numeric Values
Each percentage can represent a portion of the same total. The first rate corresponds with one numeric value. The second rate corresponds with another.
This connection adds practical context. A movement of several percentage points may seem small. Its numeric effect may still be large.
For operations teams, this can reveal workload changes. Marketing teams can see additional conversions. Quality teams can estimate affected units. Finance teams can connect margins with actual amounts.
Total value → first percentage → first numeric value
Total value → second percentage → second numeric value
First numeric value → change → second numeric value
How Reverse Solving Helps When the Total or Percentage Is Missing
Sometimes a report includes a percentage and its actual amount. The total may not appear. In another report, the total and amount may be known.
Supported reverse solving can recover the missing relationship. This is helpful when validating dashboards. It can also reveal inconsistent source data.
The key is using related values from the same measurement base. Mixing unrelated totals can create believable but meaningless results.
How Value Difference Connects Two Numeric Results
The numeric difference shows the direct movement between two corresponding amounts. It can be positive, negative, or zero.
That value can make percentage movement easier to explain. Executives may understand “additional customers” faster than rate movement alone.
Why Data Context Matters Before You Trust the Numeric Result
The total must represent the same underlying population. The percentages must describe compatible measures. The time periods should also support comparison.
A clean calculation cannot repair mismatched source data. Check the data context before making a decision.
Percentage Points and Basis Points in Real Decisions
Small rate movements can become hard to communicate. Finance teams often face this problem. A tiny decimal change may be easy to misread.
Percentage points work well for broad percentage comparisons. Basis points can make very small rate changes easier to discuss.
When Percentage Points Are Better for Clear Reporting
Percentage points are usually clearer when comparing familiar percentage rates. Readers can connect the result directly with the original values.
This works well for margins and conversion rates. It also suits market share and retention. The language stays simple and widely understood.
Clear reporting matters more than impressive terminology. Use the unit that reduces confusion for your audience.
When Basis Points Can Make Small Rate Movements Easier to Read
Basis points are common when small rate changes need extra precision. They can make tiny movements easier to communicate.
This often helps in rate-sensitive discussions. However, the audience must understand the unit. Otherwise, a simpler percentage-point statement may work better.
A good dashboard can support both forms. The goal is not to add complexity. The goal is to remove ambiguity.
Why Clear Percentage Reporting Can Prevent Expensive Decisions
A reporting mistake can change how performance appears. It can exaggerate improvement or hide deterioration. The calculation may be correct while the wording fails.
Good communication keeps three ideas separate. Show the original rate. Show the new rate. Then label the change correctly.
AxiCalculator is designed around that clarity. Use the calculator when you need a fast comparison. Reverse solving can help when your source data is incomplete.
For repeated analysis, keep the same reporting language across your team. Consistent wording makes dashboards easier to compare. It also reduces review time.
The final decision still belongs to the user. The calculator handles the mathematical relationship. Your data context determines what that result means.
Frequently Asked Questions
Can I compare percentages that come from different total counts?
Why does my dashboard show a different percentage-point change?
Can a percentage-point change tell me whether performance actually improved?
What should I do if the source percentages were already rounded?
How should I handle weighted or aggregated rates before calculating percentage points?
Does a percentage-point difference prove that a measured change is statistically significant?
How can I audit a reverse-solved result before using it in a professional report?
Engineering Resources
Our engineers are here to help you get it right.